INDICATORS
Combining Gann's 50% Rule With VIDYA
by Gerald Marisch
Sometimes, the most puzzling of trading questions can be answered with the simplest of technical methods. Here, two such methods are combined for trading: Tushar Chande's variable indexed dynamic average (VIDYA), a moving average that automatically adjusts to the current market's volatility, is used as a trend indicator, and a classic rule of thumb from early-day trader W.D. Gann known as the 50% rule is added.
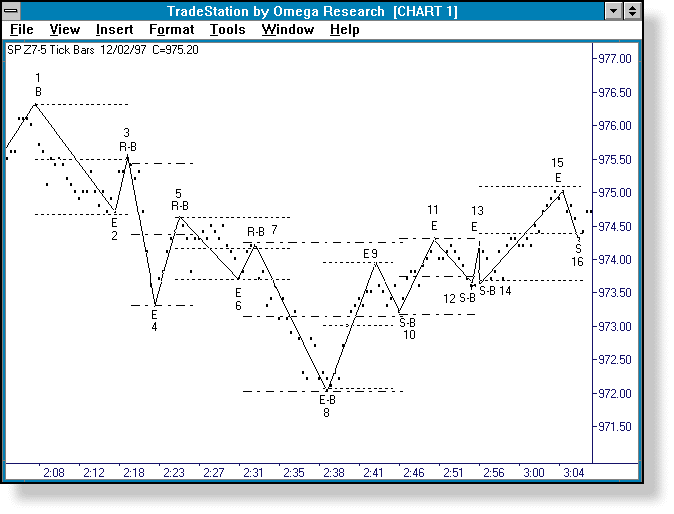
Off-floor, intraday traders are faced with decisions throughout the trading day. Two of the simpler yet most perplexing questions, are, first: Which way are prices trending? And second: Is the reaction occurring during a trend, part of the trend, or the end of the trend? For the answers to these questions and many more, consider W.D. Gann's 50% rule, and a previously introduced trend monitor called the VIDYA 21,5.
WILLIAM D. GANN
Numerous books and articles written have been written about legendary technician William D. Gann. Conflicts about his analytical abilities to project market prices range from retrospective interpretation of price trends to his use of complex proprietary numbers and their relationship, astrology and psychology to generate profits. The reported amount of Gann's profits range from a moderate income from selling his systems to a net lifetime gain exceeding $50 million from trading the markets.Whatever the case, Gann's 50% rule is irrefutable and has withstood the test of time. The strictures of the rule, according to W.D. Gann's How to Make Profits in Commodities, are:
-Always remember that the 50% reaction or halfway point of the range fluctuation of the extreme highest point is a point for support on the downside or for meeting selling and resistance on the way up. This is the balancing point, because it divides the range of fluctuation into two equal parts.
-You can make a fortune by following this one rule alone. A careful study and review of past movements in any commodity will prove to you beyond doubt that this rule works and that you can make profits following it. You will always make the most money following the main trend of the market ? by waiting for a definite indication of the trend before buying and selling.
-The next most important point for tops or bottoms is three-fourths, or 75%. Doubling the 50%, or 100%, is the next most important point.VIDYA 21,5
The concept of using the variable indexed dynamic average (VIDYA) 21,5 concept for intraday trading, originally developed by STOCKS & COMMODITIES Contributing Editor and analyst Tushar Chande, was introduced in the January 1998 issue. The VIDYA 21,5 is an exponential moving average but mathematically structured to be sensitive to a bull or bear trend and compared with a nontrending horizontal channel. When combined with Gann's 50% rule, VIDYA 21,5 results in a greater interpretation of the market's language. Definitions and rules are paramount to trading successfully. Here, then, are my first set of rules for using the 50% rule and VIDYA 21,5:1 In a bear market, closes will always be below the VIDYA 21,5.
- In a bull market, closes will always be above the VIDYA 21,5.
- In a nontrending (sideways) market, the VIDYA 21,5 will be horizontal.
- When the trend is changing direction, the VIDYA 21,5 will turn at a sharp angle.
2 In a bear market (the main, or impulse, trend is down), a price retracement will occur at the 50% level of the prior bear trend.
- Retracements will find resistance at the 50% level.
- Retracements finding resistance at a level less than 50% of the prior bear impulse trend is a sign of a continuing strong bear trend.
- Retracements finding resistance at a level more than 50% of the prior bear impulse trend is a sign of a slowing bear trend.

Excerpted from an article originally published in the March 1998 issue of Technical Analysis of STOCKS & COMMODITIES magazine. All rights reserved. © Copyright 1998, Technical Analysis, Inc.