NEW TECHNIQUES
by Gary Anderson
Risk is routinely measured as standard deviation, or volatility. Certainly, volatility is risky. But as a definition, volatility does not cover what most of us mean by risk. Could we come up with a more intuitive measure of risk than we have available? In order to be relevant, any workable approach must be guided by the practical concerns of investors. In order to communicate, our language would have to remain true to ordinary definitions. A method with which to measure risk that everyone will understand must be based on what is already a given. With this in mind, we asked a basic question of clients and colleagues: Why do investors hire managers? The answers that came back to us were consistent and not very surprising: First, investors hire managers to create gains, and second, investors hire managers to protect capital against loss.
MEASURING SUCCESS
Markets are risky. And risk, as everyone knows, involves the possibility of loss. The connection we all make between risk and loss is intuitive and powerful. Because the probability of equity loss is greatest when markets are falling, a manager's ability to defend capital against loss is most critically tested and therefore best measured during periods of general market decline. We reasoned that by isolating a manager's performance during negative-return periods, we would be able to quantify the success with which a manager defends against loss just when the risk of loss is greatest.
Rising markets are risky, too. Regardless of how well a manager defends against loss during falling markets, if he is unable to earn satisfactory returns when the market rises, he subjects his clients to another risk: lost opportunity. Since opportunity risk is always highest as the general market advances, it is best measured when the market is rising.

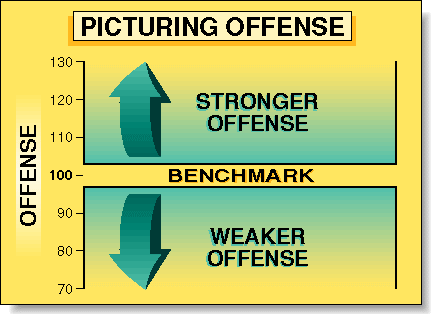
FIGURE 1: OFFENSE. The vertical axis displays offensive performance, relative to the benchmark. To beat the benchmark offensively, a target must outperform the benchmark when the market rises. Offensive scores above 100 indicate that the target's cumulative offensive return exceeded the benchmark. A weak offense underperforms the benchmark during rising periods and earns a score below 100.
Gary Anderson, gary@trend-alert.com, is a principal with Anderson & Loe and advises professional money managers from Eugene, OR. Anderson also publishes Trend-Alert, a semimonthly market commentary.