NOVICE TRADER
Applying Moving Averages
by John Sweeney
The moving average, one of the first technical methods that novice traders study, can be applied to your favorite markets. Here are its strengths and weaknesses.
It is commonplace to honor simplicity but to simultaneously forsake it. The proliferation of indicators developed in the past 10 years alone is testament to that. What is simple is that prices are rising, falling or unchanging. What is complex are the indicators, mathematical contortions depicting the movement of price and volume in some abstracted form.
As a fan of the objectivity of indicators, I nevertheless try to keep in mind what message they are trying to tell us. In many cases, the message is something as simple as Prices have risen. Note the past tense; no indicator uses future prices as inputs. When an indicator starts to move, price has already moved. To bring our perception closer to reality, we start talking about lines crossing or levels being breached or cyclic content or waves or neurofuzzy relationships or -- well, you name it. While these things have their place, their ranking is low compared with the fundamental observation: Price has moved.
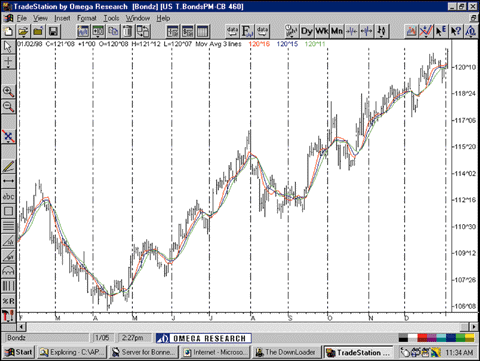
So the virtue of moving averages is that they portray the obvious. They cannot go up unless price goes up, and they cannot go down unless price goes down. That is the first valuable function of moving averages: confirming what we know.
Not only that, in a trend?, moving averages form a boundary of progress, a moving level of support that adapts to actual price movements. Though not as responsive as parabolics?, they nevertheless can be fitted to tradables, especially futures contracts, to provide good buy points. And if you are cagey enough to fade? a trend, they can help find good entry points for this too. In this manner, an established trend can be played from both sides: adding on trades to the underlying position and trading against the trend when excess occurs.
Sophisticated mechanisms, primarily cyclical, can be used to identify the precise average to use for a trading vehicle, but identifying it visually is equally acceptable. Not only that, identifying the average manually allows you to fit the curve of the average to the bar chart as tightly or as loosely as you choose. Most people use two averages for this purpose -- one average with just a few prices and another average, often derived from a weekly chart, with many more.

John Sweeney is Technical Editor of STOCKS& COMMODITIES.
Excerpted from an article originally published in the April 1998 issue of Technical Analysis of STOCKS & COMMODITIES magazine. All rights reserved. © Copyright 1998, Technical Analysis, Inc.