May 1998 TRADERS' TIPS

Here is this month's selection of Traders' Tips, contributed by various developers of technical analysis software to help readers more easily implement some of the strategies presented in this issue.

You can copy these formulas and programs for easy use in your spreadsheet or analysis software. Simply "select" the desired text by highlighting as you would in any word processing program, then use your standard key command for copy or choose "copy" from the browser menu. The copied text can then be "pasted" into any open spreadsheet or other software by selecting an insertion point and executing a paste command. By toggling back and forth between an application window and the open Web page, data can be transferred with ease.

This month's tips include formulas and programs for:

METASTOCK FOR WINDOWS
TRADESTATION/SUPERCHARTS
TECHNIFILTER PLUS
WAVEWI$E MARKET SPREADSHEET
SMARTRADER

 
or return to May 1998 Contents

METASTOCK FOR WINDOWS

In my article "Automatic support and resistance" in this issue, I present a computerized approach to finding support and resistance levels on a chart. To recreate the indicators and system described in my article using MetaStock for Windows, enter the following formulas:

Indicators:

S1: IF(Ref(LOW,-4)=LLV(LOW,9),Ref(LOW,-4),PREVIOUS) S2: IF(Fml("S1")=Ref(Fml("S1"),-1),PREVIOUS,Ref(Fml("S1"),-1)) S3: IF(Fml("S1")=Ref(Fml("S1"),-1),PREVIOUS,Ref(Fml("S2"),-1)) S4: IF(Fml("S1")=Ref(Fml("S1"),-1),PREVIOUS,Ref(Fml("S3"),-1)) S5: IF(Fml("S1")=Ref(Fml("S1"),-1),PREVIOUS,Ref(Fml("S4"),-1)) S6: IF(Fml("S1")=Ref(Fml("S1"),-1),PREVIOUS,Ref(Fml("S5"),-1))

WSO: 100*(1?(Int(Fml("S1")/CLOSE)+Int(Fml("S2")/CLOSE)+Int(Fml("S3")/CLOSE)+Int(Fml("S4")/CLOSE) +Int(Fml("S5")/CLOSE)+Int(Fml("S6")/CLOSE))/6)

R1: IF(Ref(HIGH,-4)=HHV(HIGH,9),Ref(HIGH,-4),PREVIOUS) R2: IF(Fml("R1")=Ref(Fml("R1"),-1),PREVIOUS,Ref(Fml("R1"),-1)) R3: IF(Fml("R1")=Ref(Fml("R1"),-1),PREVIOUS,Ref(Fml("R2"),-1)) R4: IF(Fml("R1")=Ref(Fml("R1"),-1),PREVIOUS,Ref(Fml("R3"),-1)) R5: IF(Fml("R1")=Ref(Fml("R1"),-1),PREVIOUS,Ref(Fml("R4"),-1)) R6: IF(Fml("R1")=Ref(Fml("R1"),-1),PREVIOUS,Ref(Fml("R5"),-1))

WRO: 100*(1?(Int(Fml("R1")/CLOSE)+Int(Fml("R2")/CLOSE) +Int(Fml("R3")/CLOSE)+Int(Fml("R4")/CLOSE) +Int(Fml("R5")/CLOSE)+Int(Fml("R6")/CLOSE))/6)

The indicators S1 through S6 and R1 through R6 should be plotted as points and not as a continuous line.

Trading System Formulas and Parameters: Enter long positions on either building support or sustained uptrend and exit position using stops. No short positions.

Enter Long: Fml("WSO") > Mov( Fml("WSO") , 4 , S ) OR Mov( Fml("WRO") , 30 , S ) > 95

Stop Out:

Breakeven stop: Floor level at 2%

Trailing stop: Profit risk of 10 Percent, ignoring 10 periods

Maximum loss stop: Maximum loss of 7%

Other Conditions:

Initial equity = 1000, Long positions only, Trade price = close, Trade delay = 0, Entry commission = 0%, Exit commission = 0%, , Interest rate = 5%, Margin req. 100%

-- Mel Widner, Ph.D., 703 791-5910
E-mail techstrategies@msn.com.
GO BACK

TRADESTATION/SUPERCHARTS

In our Traders' Tip this month, we'll focus on the support and resistance oscillators detailed by Mel Widner in "Automated support and resistance." The EasyLanguage code shown uses two functions, WRO and WSO, to provide the calculations for the support and resistance oscillator.

Before creating the support-resistance indicator, the WRO and WSO functions must first be created and verified in the Power Editor.

Type: Function

Name: WSO

Inputs: Strength(Numeric), Length(Numeric);

Vars: SCalc(0);

Array: Support[100](0);

Condition1 = SwingLow(1, Low, Strength, Strength+1) <> -1;

IF Condition1 Then Begin

For value1 = 100 DownTo 2 Begin
Support[value1] = Support[value1-1];
End;

Support[1] = Low[Strength];

End;

IF Support[Length] <> 0 Then Begin

SCalc = 0;

For value1 = 1 To Length Begin

SCalc = SCalc + IntPortion(Support[value1] / Close);
End;

WSO = 100 * (1 - (SCalc / Length));

End Else
WSO = 0;
Type: Function

Name: WRO

Inputs: Strength(Numeric), Length(Numeric);

Vars: RCalc(0);

Array: Resist[100](0);

Condition1 = SwingHigh(1, High, Strength, Strength+1) <> -1;

IF Condition1 Then Begin
For value1 = 100 DownTo 2 Begin
Resist[value1] = Resist[value1-1];
End;

Resist[1] = High[Strength];

End;

IF Resist[Length] <> 0 Then Begin

RCalc = 0;

For value1 = 1 To Length Begin

RCalc = RCalc + IntPortion(Resist[value1] / Close);
End;

WRO = 100 * (1 - (RCalc / Length));


End Else
WRO = 0;
Once the WRO and WSO functions have been created and verified, the support-resistance indicator can then be created. Because the necessary calculations have already been taken care of by the functions, building the indicator is quite simple.

Type: Indicator

Name: Support-Resistance

Inputs: Strength(4), Length(6);

Plot1(WSO(Strength, Length), "SupportOsc");

Plot2(WRO(Strength, Length), "ResistOsc");

The two functions that were created can also be used for the long system entries described by Widner. Below is the EasyLanguage code for the entries that are based on the position of the WSO and the WRO. The suggested stops for the entries described by Widner can all be set in the Stops tab.

Type: System

Name: Support-Resistance

Inputs: Strength(4),Length(6),AvgLen(30),BuyLen(4),BuyLev(95);

IF MRO(WSO(Strength, Length)>Average(WSO(Strength, Length), AvgLen), BuyLen, 1) <> -1 Then Buy This Bar on Close;

IF Average(WRO(Strength, Length), AvgLen) Crosses Above BuyLev Then Buy This Bar on Close;

This EasyLanguage code is also available at Omega Research's Web site; the name of the file is "SuppRes.ela." Please note that all Traders' Tips and techniques that are posted at the site can be utilized by either TradeStation or SuperCharts. Whenever possible, the posted analysis techniques will include both QuickEditor and PowerEditor formats.
-- Gaston Sanchez, Omega Research 800 422-8587, 305 270-1095
Internet: https://www.omegaresearch.com

GO BACK


TECHNIFILTER PLUS

The four TechniFilter Plus formulas shown here implement the tools discussed by Mel Widner in his "Automated support and resistance." The support and resistance formulas are similar; they return the support and resistance levels that Widner discusses. For support, line 1 spikes to 1 on the days with a change of support lines; otherwise, it's zero. For resistance, line 1 spikes to 1 on the days with a change of resistance lines, and is zero otherwise. Line 2 in support is a recursive calculation that returns the current support value. This line changes value only when line 1 spikes to 1. The formulas for WRO and WSO are also similar. They only differ in line 1. In WRO, line 1 spikes to the new resistance level on the days that the levels change; otherwise, it is zero. Lines 2 to 7 use TechniFilter's U3n modifiers to return the nth peak back on line 1. These values correspond to Widner's stack of previous resistance levels. Line 8 combines these values to compute Widner's WRO. The formulas for support and resistance, WSO and WRO, are thus:

NAME: Support

SWITCHES: multiline recursive

PARAMETERS: 9,4

INITIAL VALUE: L

FORMULA: [1]: LY&2=LN&1 [2]:[1]*LY&2+([1]=0)*TY1

NAME: Resistance

SWITCHES: multiline recursive

PARAMETERS: 9,4

INITIAL VALUE: H

FORMULA: [1]: HY&2=HM&1
[2]:[1]*HY&2+([1]=0)*TY1
NAME: WSO

SWITCHES: multiline

PARAMETERS: 9,4

FORMULA: [1]: LY&2* (LY&2=LN&1)
[2]:[1]U31>C {S1>C}

[3]:[1]U32>C {S2>C}

[4]:[1]U33>C {S3>C}

[5]:[1]U34>C {S4>C}

[6]:[1]U35>C {S5>C}

[7]:[1]U36>C {S6>C}

[8]:100*(1-([2]+[3]+[4]+[5]+[6]+[7])/6)

NAME: WRO

SWITCHES: multiline

PARAMETERS: 9,4

FORMULA:[1]:HY&2*(HY&2=HM&1)
[2]:[1]U31>C {R1>C}

[3]:[1]U32>C {R2>C}

[4]:[1]U33>C {R3>C}

[5]:[1]U34>C {R4>C}

[6]:[1]U35>C {R5>C}

[7]:[1]U36>C {R6>C}

[8]:100*(1-([2]+[3]+[4]+[5]+[6]+[7])/6)

These formulas are also available at RTR's Web site.
-- Clay Burch, RTR Software 919 510-0608
E-mail: rtrsoft@aol.com
Internet: https://www.rtrsoftware.com

GO BACK


WAVE WI$E MARKET SPREADSHEET

This month, our Traders' Tip focuses on the support and resistance oscillators presented by Mel Widner in his article, "Automated support and resistance."

In this Wave Wi$e implementation, a "period" column is included that allows the lookback period to be changed. According to Widner, the lookback period must be an odd number.

A: DATE @CTRAC(d:\data\metastok\test1,S&P 500 INDEX,DB)

B: HIGH

C: LOW

D: CLOSE

E: OPEN

F: Period 9

G: S1 @INIT(PERIOD-1,LOW); @IF(LOW[-PERIOD/2]=@MIN(LOW,PERIOD),LOW[-PERIOD/2],S1[-1])

H: S2 @INIT(PERIOD-1,LOW); @IF(S1=S1[-1],S2[-1],S1[-1])

I: S3 @INIT(PERIOD-1,LOW); @IF(S1=S1[-1],S3[-1],S2[-1])

J: S4 @INIT(PERIOD-1,LOW); @IF(S1=S1[-1],S4[-1],S3[-1])

K: S5 @INIT(PERIOD-1,LOW); @IF(S1=S1[-1],S5[-1],S4[-1])

L: S6 @INIT(PERIOD-1,LOW); @IF(S1=S1[-1],S6[-1],S5[-1])

M: R1 @INIT(PERIOD-1,HIGH); @IF(HIGH[-PERIOD/2]=@MAX(HIGH,PERIOD),HIGH[- PERIOD/2],R1[-1])

N: R2 @INIT(PERIOD-1,HIGH); @IF(R1=R1[-1],R2[-1],R1[-1])

O: R3 @INIT(PERIOD-1,HIGH); @IF(R1=R1[-1],R3[-1],R2[-1])

P: R4 @INIT(PERIOD-1,HIGH); @IF(R1=R1[-1],R4[-1],R3[-1])

Q: R5 @INIT(PERIOD-1,HIGH); @IF(R1=R1[-1],R5[-1],R4[-1])

R: R6 @INIT(PERIOD-1,HIGH); @IF(R1=R1[-1],R6[-1],R5[-1])

S:Sosc 100*(1(@INT(S1/CLOSE) +@INT(S2/CLOSE)+ @INT(S3/CLOSE)+@INT(S4/CLOSE)+ @INT(S5/CLOSE) +@INT(S6/CLOSE))/6)

T: Rosc 100*(1-(@INT(R1/CLOSE)+@INT(R2/CLOSE)+ @INT(R3/CLOSE)+@INT(R4/CLOSE)+ @INT(R5/CLOSE)+@INT(R6/CLOSE))/6)

-- Peter Di Girolamo, Jerome Technology 908 369-7503
E-mail: jtiware@aol.com
Internet: https://members.aol.com/jtiware

GO BACK


SMARTRADER

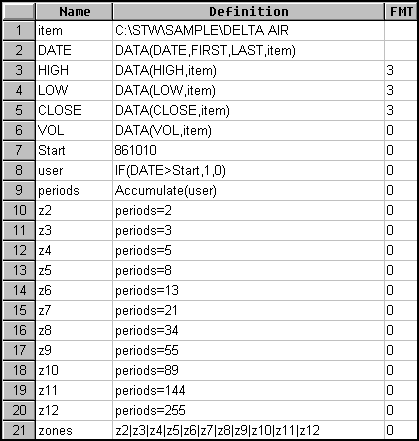
For you Fibonacci enthusiasts, here's a Traders' Tip that describes how SmarTrader can count from a user-supplied date to determine Fibonacci time zones and apply a graphic to the chart reflecting each zone.

In Figure 1, Row 7, is a coefficient that carries the start date for determining time zones. Row 8 is an if statement that returns a "1" if the date is greater than the start date. Row 9, labeled "periods," uses the "accumulate" function to count the periods following the start date. Rows 10 through 20 (which allow you to define zones according to your needs) are conditional statements that return a "1" if true or zero if false. Row 21, labeled "zones," is a conditional statement containing multiple or (as signified by the "|") conditions based on the previously defined Fibonacci numbers.

FIGURE 1: SMARTRADER. This SMARTrader specsheet implements Fibonacci time zones.

Zones can be plotted as an overlay histogram plot in the price chart window, or any associated indicator window as the user feels is appropriate. The specsheet file for this article can be downloaded from Stratagem Software's Web site.

-- Jim Ritter, Stratagem Software International 504 885-7353
E-mail: Stratagem1@aol.com
Internet: https://members.aol.com/stratagem1
GO BACK

Return to May 1998 Contents