NEW TECHNIQUES
by Walter T. Downs, Ph.D.
Market structure has undergone numerous changes in the past 10 years. A new market paradigm appears to have developed as a result of these changes, and also as a result, common variables in the market appear to have changed and are currently having an impact on technical forecasting tools. The concept of variable mutation can be used to analyze market movement. But first, some basic definitions are in order.
The first term is trending structure. This market structure is defined by a primary trend, with smaller retracements considered to be pullbacks within the larger trend. System and indicator signals are generated on breakouts of a defined range, or retracements within a larger trend phase.
The second is nontrending structure, a market structure defined by sideways price movement between support and resistance. System and indicator signals are generated on reversal from levels of support and resistance.
Technical tools, whether they are systems or indicators, address popular structural theory in terms of market timing; the perfect market timing tool would allow a trader to enter a trade at zero risk while retaining a high probability of maximum profit.
But perfection for traders is an elusive goal. One reason is the variables that traders use, which can mutate over time.
VARIABLE MUTATIONS
Systems and indicators generate signals based on a series of variables. A variable is an input factor that changes over time. A change in market structure can drastically affect the worth of a variable as predictive market timing input. Variables gain or lose predictive value in accordance with changing market structure.
Traders design systems and indicators to generate signals based on preconceived notions of what value a particular variable has in relation to the market. By not taking into account the mutational value of a variable, the effectiveness of the system or indicator is greatly diminished. It is the mutational value of a variable that is key to the success of a trading system.
From my observations, I compiled the following hypotheses:
- If indicators or systems do not define the correct structure of a market, they fail.
- Current market structures do not allow for recognition of mutated variables.
- If the other two hypotheses could be proved, then it is possible that variable mutation due to an unrecognized change in market structure is a primary cause in system and indicator failure.
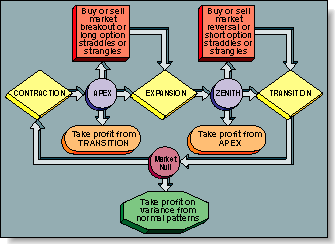
FIGURE 1: FLOW CHART. For any system, a flow chart should be developed to express the rules.
Standard deviation measures price variance in relation to the mean (average price). This variance is measured both above and below the mean and is usually applied in multiples of one, two or three deviations
Walt Downs is a professional trader and market analyst. He specializes in the implementation of emotion, psychology, martial theory and technical strategies and tactics. He may be reached at Internet https://cistrader.com/, E-mail knight@cyberspy.com or at 813 782-8988.