NOVICE TRADER
by John Sweeney
A few months ago, I pointed out that moving averages are neat boundaries for trending action. Short-term averages are also handy for finding yourself in a trading range. How can that be, you ask? Usually, averages are curses for their behavior in a trading range. Those who use them to enter trends find themselves trading in and out rapidly, usually losing money in the process. By the very nature of moving averages, the delay built into them make for bad decisions -- a trend-entry trade -- when, in fact, prices have found a level and are simply oscillating around it. You end up going long or short just as prices head down or back up into the range.
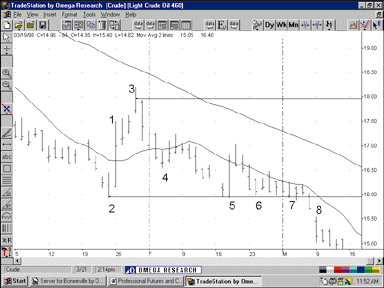
However, you can turn this behavior to achieve your own ends by observing that the very characteristic of an average in a trend is that it is not crossed by price. In an uptrend, it's below price and in a downtrend, it's above price. If price has crossed your trending average (Figure 1, point 1), your antenna goes up. Here is the first indication that a trading range is forming, not that a new trend is taking place. Perhaps support and resistance have been hit and price is about to start fluctuating in a relatively fixed area. Just in case this is so, label the crossing "1" and the previous low (or high, if you were trending long instead of short) "2."
Even with this insight, your first decision must be to go with the trend signal on the assumption that trend has reversed. If you have, in fact, entered into a trading range, you'll lose on this trade, but you are committed by your trading system to taking it, nevertheless.
For example, in Figure 1, your short-term average ticks upward one day after the crossing of the average at point 1. For many, that's the signal to go long. (For others, it's a signal to exit until price has cleared the longer-term average.) For price watchers, it simply means some strong buyers existed around $16 a barrel!
Now, price moves upward toward point 3, and you, as a trend trader, are happy until it reverses down across the moving average to point 4. Undoubtedly, your stop on the trend trade taken around point 1 has been hit and you are out. What's next?

FIGURE 1: CRUDE ACTIVITY. Crude hits support in early 1998, and the first clue is price crossing the moving average. Take note by labeling that point as1 when that occurs. Point 2 is then noted as the low prior to the crossing, and point 3 is labeled when price recrosses en route to point 4.
John Sweeney is Technical Editor of STOCKS & COMMODITIES magazine.