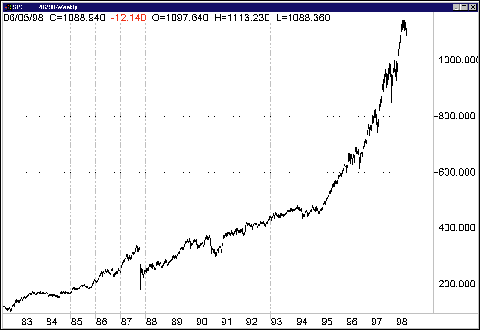
As a rule, the results of any trading system are evaluated in terms of dollar returns. This means that a $10,000 loss on the Standard & Poor's 500 futures contract is considered simply to be a $10,000 loss, without taking into account the period in which the loss has occurred. As an example, in August 1982, the S&P was trading around 110 points (Figure 1), at a face value amount of $55,000. At that time, assuming a single point of the S&P contract was the equivalent of $500, a $10,000 loss meant an 18.18% loss expressed in terms of percentage returns. On the other hand, 15 years later, in August 1997, the same $10,000 loss would have turned out to be a 2.10% loss (the S&P was trading around 950 points, or at a $475,000 face value). The 20-point loss that would have been defined as just a bad trade in 1997 would have destroyed your trading career in 1982.
STATISTICS
Using Percentage-Based Back-Adjusted Data
by Enrico Donner, Ph.D.
A continuous data series for modeling a futures trading system can be created in a number of ways. Here's a new method that uses a percentage-based back-adjusted technique to ensure that profits and losses from a trading system are equivalent over time on a percentage basis.
DATA SERIES
When we analyze futures contracts, we usually find four kinds of data series:The single data series is the most common data format. The term refers to a certain expiration month, and start from the beginning (with usually low volumes) to the last trade's date (Figure 2).
- Single data series
- Nearest futures data series
- Perpetual (constant-forward) data series
- Merged (back-adjusted) data series.
The nearest future data is simply the union of several single data series, one after the other. The day before the expiration date of the current contract is usually chosen as the starting date for the following contract. Some providers (such as FutureSource) refer to this data format as perpetual. The major problem that may occur using the nearest future data while testing trading systems is that we may get false results because of the spread between the two following months (Figure 3).

Excerpted from an article originally published in the September1998 issue of Technical Analysis of STOCKS & COMMODITIES magazine. All rights reserved. © Copyright 1998, Technical Analysis, Inc.