TRADING TECHNIQUES
by Dennis L. Tilley
Moving averages are a popular way to signal trends. Here's how to combine moving averages and the classic chart analysis of support and resistance for trading mutual funds.
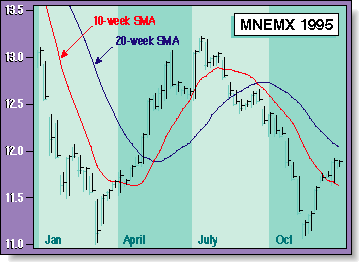
Most simple moving average systems require one or two additional confirmation signals to avoid excessive whipsaw trades. Such confirmation signals can be based on features of moving averages such as the crossover of multiple moving averages or the reversal of the moving average slope. Momentum, volatility, volume and other nontrend indicators can also serve to confirm moving average buy and sell signals.
In an effort to develop simple and robust stock and mutual fund trading systems, I have found that combining the simple moving average (SMA) with the concept of resistance and support very effective. Here is a mechanical system for combining these two tried-and-true tools to provide a robust, minimal-whipsaw, intermediate-term mutual fund trading system. I have used this system successfully for about four years to switch emerging markets funds and small-cap funds to and from a Standard & Poor's 500 index fund and/or a money market fund.
SMA STRENGTHS
I use the most common implementation of an SMA system, which is to buy when the price closes above the SMA and sell when the price falls below the SMA. The strengths of the SMA system compared to other trading techniques are objectivity, simplicity and its trend-following nature. The SMA is objective because it provides unambiguous buy and sell signals; thus, it can be back-tested and suitably optimized.
The simplicity of the SMA, in that it has only one parameter to fit (the lookback period), generally leads to a robust system. By robust, I mean that it stands a good chance of working in the future. As discussed in a recent STOCKS & COMMODITIES article by Jeffrey Owen Katz and Donna McCormick, a rule of thumb in evaluating trading systems is that the more parameters there is to optimize, the less robust the system is. Taken to the extreme, many fitting parameters can be used to curve-fit past data to eliminate all whipsaws while maintaining good performance. The potential of such a system working in the real world is nil.
The trend-following feature of the SMA is highly desirable because it resists becoming outdated as markets change character. Independent of the fundamentals driving the market, trend-following techniques are designed to capture extended runs in both bullish and bearish directions. This is especially true for intermediate time-scale movements in the stock market -- those where typical peak-to-trough and trough-to-peak movements are in the 10-30% range, with a corresponding time scale on the order of two to six months.
