According to long-term Fibonacci? support and resistance levels in the Dow Jones Industrial Average (DJIA), we are approaching a notable resistance level in the stock market. Many books have been written on the Fibonacci sequence and its many mathematical relationships; this article will not delve into those in any great detail. For those who are unfamiliar with the Fibonacci sequence, however, I will briefly discuss its basis and a few of its mathematical relationships and how they are relevant to investors.
CLASSIC TECHNIQUES
Long-Term Fibonacci Support And Resistance
by Kevin W. Murphy
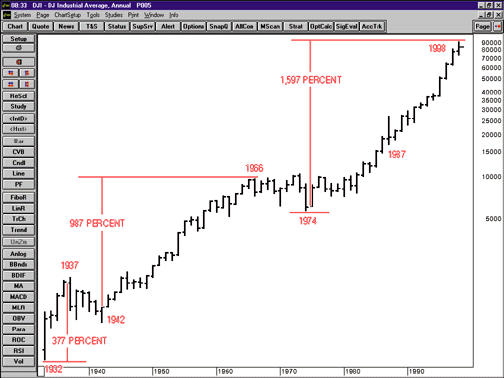
Here's a historical review of the major swings in the stock market and the Fibonacci relationships.
Leonardo of Pisa, a 13th-century mathematician, illustrated what would later be known as the Fibonacci sequence in his work Liber Abacci, although its mathematical relationships were not detailed until much later. The Fibonacci sequence is an additive sequence in which each number is the sum of the two numbers preceding it. Beginning the sequence with 1, it progresses thus: 1, 1, 2, 3, 5, 8, 13, 21, 34, 55, 89, 144, 233, 377, 610, 987, 1597 ... on to infinity.
As the sequence continues to infinity, the ratio of each number to its preceding number approaches 1.61803398 (also known as the golden ratio). Because it is an additive sequence, any two numbers can be used to begin the sequence and added together to produce a third and so on. Whatever two numbers are used to begin the sequence, the resulting ratio between each preceding number will ultimately approach 1.61803398. Within the sequence, the mathematical relationships of Fibonacci numbers are depicted: the ratio of any number to the following number in the sequence is 0.618, which is the inverse of 1.618. The ratio between alternate numbers is 3.618 or its inverse, 0.382. Moreover, 0.382 plus 0.618 equal 1 and (0.618)(0.618) equals 0.382.
The mathematics of the Fibonacci sequence are well-documented and you may want to test out a few numbers for yourself. For the purpose of our analysis, we are now going to apply the mathematics of Fibonacci to the Dow Jones Industrial Average (DJIA) dating back to the 1930s. Before we do, however, we must introduce the first person to apply Fibonacci mathematics to the stock market, Ralph Nelson Elliott, who devised the Elliott wave theory. Elliott described how markets moved in his wave theory, and he showed how Fibonacci mathematics can be applied to these moves. Although I will not discuss Elliott's wave theory in detail, there are two key tenets of his theory that I will apply in this article, price and time.
Excerpted from an article originally published in the October 1998 issue of Technical Analysis of STOCKS & COMMODITIES magazine. All rights reserved. © Copyright 1998, Technical Analysis, Inc.