Analysts often cite intermarket relationships when touting a market's prospects. An analyst might point out that utility stocks have reached a new high, and since they lead interest rate instruments, the fixed-income market would follow. Or an analyst might observe that copper is down, and since copper is a key price component for inflation indices, lower copper prices is bullish for bonds. When you examine the historical data and compare the impact that one market may have on another, however, some such relationships do not actually exist, and further, most of the relationships that do are not strong.
INTERMARKET ANALYSIS
Is Gold Still A Barometer?
by Alex Saitta
Is the gold market still an indicator of other trends? Here's a look at the past relationships of gold to the dollar, the Consumer Price Index (CPI) and the Bridge/Knight-Ridder Commodity Research Bureau index.
But some do, and they are worth noting.
One key barometer is the price of gold. After the inflationary period of the late 1970s and early 1980s, the price of gold as an intermarket or inflation indicator fell out of favor among Wall Street analysts. If you examine the data, however, you'll find that gold is as valuable an indicator as it ever was.
HISTORY
Business students are taught that a rising dollar causes import prices to fall, and in turn, that puts downward pressure on the prices of domestic goods and services; thereafter, gold falls in value. When the dollar falls, inflation rises and so does gold. Most analysts have ceased to believe in this relationship over the past 10 years or so. But upon examining the data, you'll see that gold's relationship with the dollar is as strong as ever, as is its relationship with inflation.
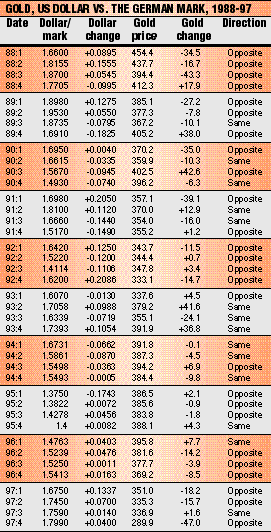
Figure 1 compares the quarterly change of the price of gold with the quarterly change of the US dollar vs. the German mark for the past 10 calendar years (40 quarters). For example, the third-quarter 1990 dollar/mark fell 0.0945, from 1.6615 to 1.5670. That same quarter, the price of gold rose 42.6, from 359.90 to 402.50. Comparing the third and fifth columns, dollar/mark and gold moved in opposite directions during that quarter. Of the past 40 quarters, gold and the dollar moved in opposite directions 26 quarters of the time, or 65%.
Excerpted from an article originally published in the October 1998 issue of Technical Analysis of STOCKS & COMMODITIES magazine. All rights reserved. © Copyright 1998, Technical Analysis, Inc.