In MetaStock for Windows, you can use the Expert Advisor to recreate the Shark-32 signals on your charts as discussed in Walter Downs's article in this issue, "Combining statistical and pattern analysis."
First, choose Expert Advisor from the Tools menu in MetaStock 6.5. Next, choose New and enter the following formulas:
Name: Click the Name tab and enter "Shark-32" in the name field.
Trends: Click the Trends tab and enter the following formulas in the bullish and bearish fields.
Bullish: Mov(C,5,S)>Mov(C,20,S);
Bearish: Mov(C,5,S)<Mov(C,20,S);
Highlights: Click the Highlights tab, choose New, and enter "3rd Bar" in the name field. Now change the color in the color field to Blue. Finally, enter the following formula in the condition field, and then choose OK.
Symmetry:=.28;
Apex:=(H+L)/2;
WB:=Ref(H,-2)-Ref(L,-2);
Shark:=If((H<Ref(H,-1) AND L>Ref(L,-1) AND Ref(H,-1)<Ref(H,-2) AND Ref(L,-1)>Ref(L,-2))=1,
If(Apex <= (Ref(H,-2)-(WB*Symmetry)) AND Apex >= (Ref(L,-2)+(WB*Symmetry)) ,1,0),0);
Shark;
Using the same method as above, enter the following two highlight formulas:
Name: 2nd Bar
Color: Blue
Condition:
Symmetry:=.28;
Apex:=(H+L)/2;
WB:=Ref(H,-2)-Ref(L,-2);
Shark:=If((H<Ref(H,-1) AND L>Ref(L,-1) AND Ref(H,-1)<Ref(H,-2) AND Ref(L,-1)>Ref(L,-2))=1,
If(Apex <= (Ref(H,-2)-(WB*Symmetry)) AND Apex >= (Ref(L,-2)+(WB*Symmetry)) ,1,0),0);
Ref(Shark,+1)=1;
Name: 1st Bar
Color: Blue
Condition:
Symmetry:=.28;
Apex:=(H+L)/2;
WB:=Ref(H,-2)-Ref(L,-2);
Shark:=If((H<Ref(H,-1) AND L>Ref(L,-1) AND Ref(H,-1)<Ref(H,-2) AND Ref(L,-1)>Ref(L,-2))=1,
If(Apex <= (Ref(H,-2)-(WB*Symmetry)) AND Apex >= (Ref(L,-2)+(WB*Symmetry)) ,1,0),0);
Ref(Shark,+2)=1;
Symbols: Click the Symbols tab, choose New and enter "Shark Buy" in the name field. Now enter the following formula in the condition field:
Symmetry:=.28;
Apex:=(H+L)/2;
WB:=Ref(H,-2)-Ref(L,-2);
Shark:=If((H<Ref(H,-1) AND L>Ref(L,-1) AND Ref(H,-1)<Ref(H,-2) AND Ref(L,-1)>Ref(L,-2))=1,
If(apex <= (Ref(H,-2)-(WB*Symmetry)) AND Apex >= (Ref(L,-2)+(WB*Symmetry)) ,1,0),0);
Buyok:=Cross(C,ValueWhen(1,Shark=1,Ref(H,-2)));
Chk:=Cum(Buyok)-ValueWhen(1,Shark=1,Cum(Buyok));
ValidChk:=Alert(Shark=1,25);
{Note: The above ValidChk variable makes the SHARK signal valid for 25 periods. If the price does not cross above the High value of the base within 25 periods, you will not receive a signal. You can change the number of periods by changing 25 to the number of periods you desire.}
Buy:= Buyok=1 AND Ref(Chk,-1)=0 AND ValidChk=1;
Buy;
Click the Graphic tab. Change the symbol in the graphic field to Buy Arrow. Now change the color in the color field to green. Finally, type "Buy" in the label field, and then choose OK.
Using the same method as above, enter the following Symbol formula.
Name: Shark Sell
Condition:
Symmetry:=.28;
Apex:=(H+L)/2;
WB:=Ref(H,-2)-Ref(L,-2);
Shark:=If((H<Ref(H,-1) AND L>Ref(L,-1) AND Ref(H,-1)<Ref(H,-2) AND Ref(L,-1)>Ref(L,-2))=1,
If(apex <= (Ref(H,-2)-(WB*Symmetry)) AND Apex >= (Ref(L,-2)+(WB*Symmetry)) ,1,0),0);
Sellok:=Cross(ValueWhen(1,Shark=1,Ref(L,-2)),C);
Chk:=Cum(Sellok)-ValueWhen(1,Shark=1,Cum(Sellok));
ValidChk:=Alert(Shark=1,25);
{Note: The above ValidChk variable makes the SHARK signal valid for 25 periods. If the price does not cross below the Low value of the base within 25 periods, you will not receive a signal. You can change the number of periods by changing 25 to the number of periods you desire.}
Sell:= Sellok=1 AND Ref(Chk,-1)=0 AND ValidChk=1;
Sell;
Symbol: Sell Arrow
Color: Red
Label: Sell
After you have finished creating the Symbol formulas, you can attach the Expert to your chart by choosing Expert Advisor from the Tools Menu. Select the Expert named "Shark-32" from your list of Experts, choose Attach, and then Close.
-- Allan J. McNichol, Equis International
800 882-3040, 801 265-8886
Internet: https://www.equis.com
GO BACK
Here's a TechniFilter Plus strategy that implements Walter Downs' SHARK-32 strategy.
Formula 2 returns a "1" whenever you have a 12% symmetric SHARK-32 pattern. Formula 3 keeps track of the pattern's high price from the high price of the base bar. Notice this formula uses the result of formula 2. If [2] = 1 (meaning that today a symmetric SHARK-2 pattern appeared), then formula 3 returns the high from two days ago (that is, the high of the base bar). If [2] = 0 (meaning no new SHARK-32 pattern today), the formula returns the most recent base bar's high. So formula 3 always maintains the high of the most recent base bar.
Similarly, formula 4 tracks the low price of the most recent base bar. Formulas 5 and 6 are recursive formulas that track the maximum close and minimum close since a symmetric SHARK-32 pattern. Again, these formulas use formula 2 to reset the max or min value when a new symmetric SHARK-32 pattern occurs. Formula 7 keeps track of whether or not a particular Shark-32 pattern has already been used. It does this by comparing the MaxClose against the SharkHigh and the MinClose against the SharkLow. We use formula 7 to prevent the same SHARK-32 pattern from triggering more than one position.
Formulas 8 and 9 mark breaks of the SHARK pattern that trigger a signal. The rules implement the trading signals suggested by Downs.
NAME:Shark32
TEST TYPE: stock
POSITION LIMIT: 1
FORMULAS-----------------------
[1] Date
[2] SymmetricShark(.12) (H<HY1 & L>LY1) & TY1 & ( ((H+L)/TY2-1)U0<&1)
[3] SharkHigh (HY2 * [2]) + TU31 * ([2]=0)
[4] SharkLow (LY2 * [2]) + TU31 * ([2]=0)
[5] MaxClose [2] * C + ([2]=0) * (C%T)
[6] MinClose [2] * C + ([2]=0) * (C#T)
[7] OpenShark ([4]>0) & ([5]>0) & ([5]<[3]) & ([6]>[4])
[8] UpBreak (C>[3]) & ([3]>0)
[9] DownBreak C<[4]
RULES-----------------------
r1: BuyLong buy long 1 on Close
at signal: AboveShark [8] & [7]Y1 & Shares=0
r2: OpenShort
open short 1 on Close
at signal: BelowShark [9] & [7]Y1 & Shares=0
r3: ReverseShort2Long
reverse short to long 1 on Close
at signal: AboveShark [8] & [7]Y1 & Shares=-1
r4: ReverseLong2Short
reverse long to short 1 on Close
at signal: BelowShark [9] & [7]Y1 & Shares=1
r5: StopLong
stop long 1 on Close
at signal: StopLong ( CurrentPrice < EntryPrice - 2 )
^ (CurrentPrice < BestPrice - 2.5)
^ (CurrentPrice - EntryPrice > 5)
r6: StopShort
stop short 1 on Close
at signal: StopShort ( CurrentPrice > EntryPrice + 2 )
^ (CurrentPrice > BestPrice + 2.5)
^ (EntryPrice - CurrentPrice > 5)
This TechniFilter Plus strategy and the reports, strategies and formulas of earlier Traders' Tips can be downloaded from RTR's Web site.
-- Clay Burch, RTR Software
919 510-0608, E-mail: rtrsoft@aol.com
Internet: https://www.rtrsoftware.com
GO BACK
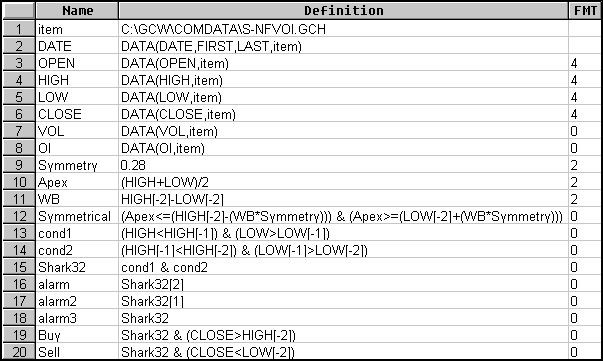
The SHARK-32 pattern described by Walter Downs in "Combining statistical and pattern analysis" in this issue is easily implemented in SmarTrader with some simple user formulas and conditional statements.
The SmarTrader specsheet is shown in Figure 1. Row 9 is a coefficient to hold the symmetry multiplier. Row 10, called "Apex," calculates the midpoint of the current bar. Row 11, "WB," calculates the range of the bar two days back. Row 12 is the symmetry true/false conditional statement.
Row 13 is the first part of the pattern, which is true if the current day's high and low are inside the previous day's high and low. Row 14 is the second part of the pattern. This row is true if the previous day's high and low are inside the high and low of the next previous day. Row 15, "SHARK-32," combines the two with a logical and (&). If both are true, then SHARK-32 is true and we have identified the triangular pattern described in the article.
Rows 16, 17 and 18 are alarm rows that allow the use of the SmartBar plot to paint the high-low range of the bars in the triangle a contrasting color. Note the absence of a minus sign, since the alarms in rows 16 and 17 must look ahead to see if SHARK-32 is true. The contrasting color yields greater visibility than using dots.
The buy rule states that SHARK-32 must be true and the close must be greater than the high of the widest bar. The sell rule states that SHARK-32 must be true and the close must be less than the low of the widest bar.

FIGURE 1: SMARTRADER SPECSHEET. This SmarTrader specsheet demonstrates the SHARK-32 pattern described by Walter Downs in "Combining statistical and pattern analysis" in this issue.
-- Jim Ritter, Stratagem Software International
504 885-7353, E-mail: Stratagem1@aol.com
Internet: https://members.aol.com/stratagem1
GO BACK
 METASTOCK
 TECHNIFILTER PLUS
 SMARTRADER
 WAVEWI$E MARKET SPREADSHEET

