Most stock market traders are familiar with the January effect, which is the tendency for smaller issues to outperform blue chips at the turn of the year. But January is certainly not the only time the stock market exhibits seasonal tendencies with the potential to be exploited in trading strategies. In fact, with the January effect apparently fading in recent years as it becomes better known, this may be a particularly good time to explore other seasonal trading opportunities.
MARKET TIMING
Seasonal Stock Index Trades
by James Greenwood
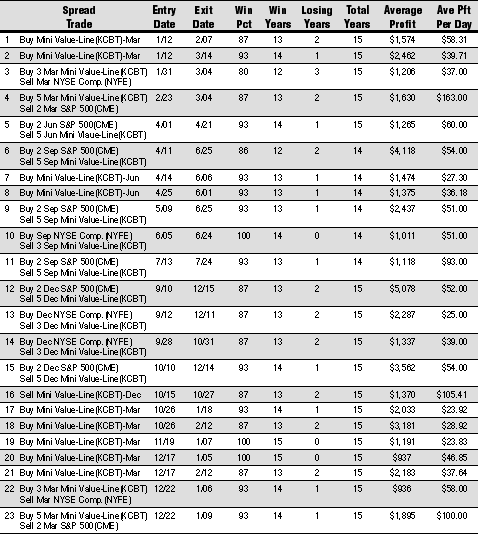
Here are different seasonal strategies for trading the Value Line Index compared with the New York Stock Exchange Composite Index and the Standard & Poor's 500.
One of the simplest ways to exploit seasonal market tendencies is through trades in stock index futures contracts. Using futures, a trader can in a single transaction buy or sell an index representing a large basket of stocks.
With the introduction in recent years of a number of new futures contracts on different indices and in different sizes, the trading possibilities are greater than before. To research strategies, however, only three product lines have a history extensive enough to draw upon for long-term analysis -- contracts based on the Standard & Poor's 500 index, the New York Stock Exchange (NYSE) Composite Index, and the Value Line. These three indices are each unique in market representation and thus present unique seasonal spread trading opportunities.
DIFFERENT INDICES, DIFFERENT MARKETS
While it can be argued that all three of these market measures tend to move in the same direction, there is a fundamental difference in the calculation of the Value Line that, when compared with the other two, results in spread trading opportunities.
The Value Line Arithmetic Index is a broad-based market measure of around 1,650 blue-chip, mid-cap and small-cap issues. About three-fourths of Value Line stocks are listed on the NYSE, 20% on the NASDAQ, and the remaining 5% are listed on the American Stock Exchange and in Canada. Comparatively, the S&P 500 is a listing of 500 blue-chip companies, while the NYSE Composite is a listing of all the approximately 2,900 stocks traded on the New York Stock Exchange.
But perhaps the most significant difference between the Value Line and the other two indices is how the Value Line is calculated. The Value Line is equally weighted, meaning that each stock has the same influence on moving the index upward or downward, regardless of company size or stock price. Both the S&P 500 and the NYSE Composite are capitalization-weighted, giving some stocks much more influence on index price direction than others. This difference between equal and capitalization weighting can result in a marked difference in the movement and performance of the indices, translating into trading opportunity.
Excerpted from an article originally published in the November 1998 issue of Technical Analysis of STOCKS & COMMODITIES magazine. All rights reserved. © Copyright 1998, Technical Analysis, Inc.