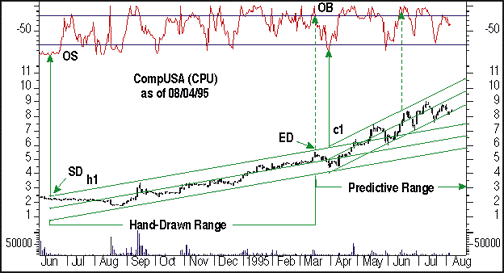
Price channels are a technique used to discover the outer boundaries of the market's action concerning a trend. One simple method is to draw a trendline along the lows and a parallel line along the highs and project both lines forward. A more scientific method is the regression channel, which was introduced by Gilbert Raff in the October 1991 STOCKS & COMMODITIES. The regression channel defines the primary trend by using a linear regression line with a lookback period selected by the user. Next, parallel channel lines are plotted above and below the extreme price excursion, thus defining the outer parallel channel lines. According to Raff, this technique offers a good deal of information regarding the technical picture.
INDICATORS
Enhancing The Raff Regression Channel
by Robert B. McKinnon
A market follows its primary trend in a zigzag form. The direction of the trend is easy enough to see, as well as countertrend moves against the primary trend. The real challenge lies in identifying where these minor trends may end. Here's the combination of a channel technique with a price oscillator to aid you in this task.
PREDICTIVE ACTION
In his book, Trading The Regression Channel, Gilbert Raff states that if we have drawn our channel correctly,
. . . [W]e'll see a remarkable process unfolding. The Regression Channel Top will be the precise point at which the high days in a trend hit resistance and turn down, and the low days will find support at the Regression Channel Bottom and turn up. Finally, a day will arrive when price exceeds the Regression Channel Range and the trend is over.Later, he states:The most powerful single requirement of a Regression Channel is that it exhibits predictive action. This means that it encompasses turns in the market that have already occurred and that it continues to do so in the future.Clearly, Raff believes that the most important trait of the regression channel is that it can predict future price movement. Based on personal experience, the resistance, support and attraction characteristics of a properly drawn channel can provide strong price movement clues that can help you decide what to do in your trading. However, it is crucial to develop the ability to correctly place regression channels so they properly define the market consensus and provide the necessary predictive action.MORE ART THAN SCIENCE
MetaStock for Windows will draw the regression channel using a simple click of the mouse, while others may need to first plot the regression line and then draw parallel trendlines. Placing regression channels correctly can be a tricky task. Picking the start date (SD) and end date (ED) for the channel can sometimes be frustrating. A user's knowledge and experience of technical analysis, personal prejudices, and various other factors come into play when drawing a regression channel. This subjectivity can lead to differences in channel placement by any two individuals, even concerning the same chart and data.
This issue of subjectivity has led me to include the use of an additional technical analysis tool that helps set aside the subjectivity. This tool is the Williams'%R indicator, which can be found in virtually every technical analysis package available. Let me share the way I use this combination of tools with you.

Excerpted from an article originally published in the November 1998 issue of Technical Analysis of STOCKS & COMMODITIES magazine. All rights reserved. © Copyright 1998, Technical Analysis, Inc.