A few years ago, I read a Federal Reserve Bank report entitled "Head-and-shoulders: Not just a flaky pattern." The authors of the piece had rigorously tested the profitability of a trading strategy based on the head-and-shoulders pattern in the foreign exchange market. The results indicated the head-and-shoulders had some predictive power for the German mark and the yen.
BASIC TECHNIQUES
Reversal Formations: Predictive Power?
by Alex Saitta
Do classic chart formations such as the head-and-shoulders or the double bottom/double top hold up to close scrutiny? Here's a look at a test of these two formations in the Treasury bond futures market.
I was taken by the study's objective approach to what has always been looked upon as a subjective pattern. I wondered if tests of the head-and-shoulders as well as of the double top/bottom would yield similar results in the Treasury bond futures market.
APPROACH
I started with the head-and-shoulders pattern. My definitions and approach are somewhat similar to those used in the Fed's study. My definitions are:
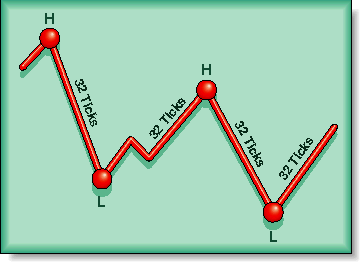
For example, in Figure 1, the moment the market drops more than 32 ticks below the initial peak, that peak is labeled a reactionary high. Following the market, the downmove continues for a while before it ends. After the market rises 32 ticks, the end of the downmove is considered a reactionary low. Successive reactionary highs and lows are labeled this way as the market swings up and down more than 32 ticks.
- Reactionary high: A reactionary high is a local maximum price, which is more than 1 point or 32 ticks above the previous reactionary low.
- Reactionary low: A reactionary low is a local minimum price, which is more than 32 ticks below the previous reactionary high.

Excerpted from an article originally published in the November 1998 issue of Technical Analysis of STOCKS & COMMODITIES magazine. All rights reserved. © Copyright 1998, Technical Analysis, Inc.