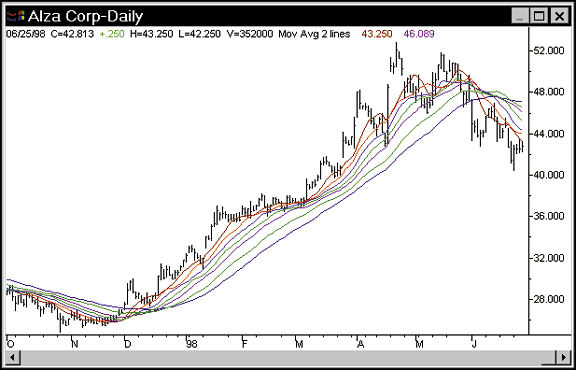
One commonly used technical indicator is the moving average (MA), which is plotted as a line connecting the average of closing prices over a lookback period. Moving averages may be used as trend indicators and to identify support and resistance levels and breakouts. The major complaint concerning moving averages is that they lag changes in the trend and thus lead to late signals.
NOVICE TRADER
Trends And Moving Averages
by Robert Nikifork
How do you choose which length and type of moving average to use for chart analysis?Take a look.
Because of that flaw and their widespread use, many articles have been written about moving averages. In most of these articles, the writers discuss exotic forms of moving averages that they feel are superior to the more common forms because they reduce the lag or follow the trend closer. Some common suggestions are methods to add an exponential factor to the moving averages, weighting recent closing prices more heavily, and using more than one moving average.
For mechanical trading systems, the length and type of moving average chosen may be significant if it is backtested and proved that, for example, a break above an x-length MA has generated larger profits and smaller drawdowns than other lengths; in such an instance, it may make sense to choose one moving average length and type. But many traders do not trade systems based on moving averages, while there are others who use them only as guidelines in making decisions about when to buy and sell. In such a case, how should a trader choose a moving average length?
With respect to simple MAs, many lengths are popular among traders, including but not limited to 10, 20, 21, 30, 50, and 200 days. But why would these be any better than, for example, 16, 24, 77, or 136? The obvious answer is that we prefer round numbers, but is there any reason why a round number would offer a trader more insightful information than any randomly chosen number?
USING MOVING AVERAGES
Now, consider how traders might use moving averages. In strong price uptrends, one would expect that the shorter the MA lookback, the faster it reacts to the uptrend and thus, the shorter MA would always be situated above the longer one during uptrends. By choosing all moving averages between two-day and 200-day MAs, we would expect that each would lie slightly higher than the previous one (Figure 1). This would create a chart cluttered with lines, most of which would be at different price levels at any point. With so many possible lines, it seems illogical that any one line would consistently offer more information than all the others. Yet many traders use these moving averages to guide their buy and sell decisions.
Traders will wait for a strong uptrend and then buy when a stock retraces back to and touches a particular MA line. At this point, the market should reverse and rally to a new high. This type of trade tends to produce a high percentage of winners. However, if you could choose from an almost infinite number of MAs, all of which are at different heights on the chart for a particular price move, how would you decide which lookback period is best for analysis? Each lookback period will predict that the current uptrend should retrace to a different point. Does this mean moving averages are useless in determining support, resistance, or breakouts? Of course not.

Excerpted from an article originally published in the December 1998 issue of Technical Analysis of STOCKS & COMMODITIES magazine. All rights reserved. © Copyright 1998, Technical Analysis, Inc.