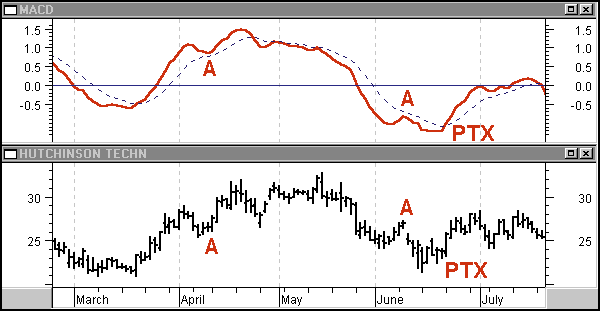
It takes more than a good entry strategy to trade profitably. Many traders have experienced the exhilaration of being in a winning trade. Some of those same traders have also known the disappointment of watching their profit turn into a loss when prices change. Knowing when to take profits is part of good money management. The moving average convergence/divergence (MACD) profit alert presented here is a pattern that helps traders make profit-taking exit decisions in both the stock and commodity markets.
INDICATORS
The MACD Profit Alert
by Barbara Star, Ph.D.
The moving average convergence/divergence (MACD) is a momentum indicator, and here it's combined with pattern recognition to help you identify exit points for your trading system.
THE VERSATILE MACD
Basically, the MACD is a momentum indicator that fluctuates above and below a zero line. Its developer, Gerald Appel, presented it as a trading method composed of two components. The first is a solid line that represents the difference between two exponentially smoothed moving averages, often referred to as the MACD line. The second component, the signal or trigger line, is a dotted line that is an exponentially smoothed moving average value of the solid line. (See sidebar "The MACD.") The MACD trading method consists of buying when the solid line crosses above its signal line and either exiting and/or short selling when the solid line crosses below its signal line.
The original MACD method continues to be a favorite among traders, useful in ways beyond the initial technique. One alternative use is as a gauge of trend when both the solid and dotted lines remain above the zero line during uptrends or below the zero line during downtrends. Another is to identify divergences between the indicator and price prior to changes in trends.
I have found yet another use for the MACD, that of a profit-taking alert and exit function based on a pattern made by the relationship between the solid and dotted lines.
THE MACD PROFIT ALERT PATTERN
The assumption underlying the use of the profit alert pattern is that the trader has already entered a trade. The entry strategy need not be tied to the MACD; it could be based on trendline or price breakouts, momentum divergences, multiple moving averages and so forth. In addition, the assumption is that the trade moves in the desired direction. With these assumptions in mind, the trader needs some way to protect profits. At this point, it may be advantageous to use the MACD profit alert pattern, which warns of a potential change in trend and suggests when to take part or all of the profits.

Excerpted from an article originally published in the December 1998 issue of Technical Analysis of STOCKS & COMMODITIES magazine. All rights reserved. © Copyright 1998, Technical Analysis, Inc.