In my previous article, I wrote that, other things being equal, a trading system with lower volatility would triumph over a system with higher volatility. To prove my point, I gave examples (and a small spreadsheet model) wherein a system with half the volatility of its competitor came out ahead 70-80% of the time when given the same sequence of trading results.
STATISTICS
The Volatility Edge
by John Sweeney
Designing a profitable trading system is key, but the way that profits and losses vary can have an impact on your long-term success. Here's a followup of the discussion in the May 1998 STOCKS& COMMODITIES about the importance of measuring the volatility of the returns in your account.
Before we go any further, I should make a point of definition: Volatility is the variance of returns from the trades. The greater the dispersion of trading results, the greater the volatility.
That said, the problem with a high-volatility system is that losses put a trader further in the hole, requiring greater percentage returns in order to recover. The classic example is starting with $100 and trying to get to $120, a 20% return. If, instead, you first lose 20%, you must have a 50% return on $80 to reach your initial goal of $120 on the next trade.
This depressing factoid met with phlegmatic resignation all around save for one reader, Serguey Sayta of Moscow, Russia, who argued that "other things" aren't always equal. He observes: "You write that returns are random, that is, they range randomly from -50% to +50%. ...But the question is, 'Will it be more profitable to use lower volatility if, for example, 55% of trades are profitable and 45% are losses?' Using your formula, if you replace 0.5 by 0.45, then in 70%+ cases, higher volatility will finish better than half volatility. Your statement that lower volatility will get more return is only applicable to a losing strategy ..."
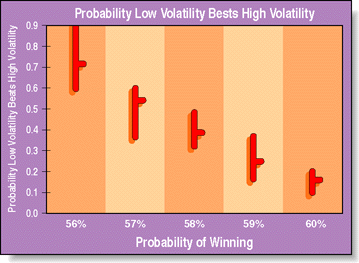
Avoiding the question of whether there actually exists any winning or losing strategies and taking the high road of randomness, Sayta has a good point. While my numbers don't line up exactly with his, as we'll see, it's correct that a winning system can tolerate more volatility. Instead of beating the high-volatility system 99% of the time, a system with half the volatility will generally beat a high-volatility system on a winning series of trades only if the probability of winning is 56% or less.
Check Figure 1. Using the familiar bar chart format, this graph shows the percentage of times the low-volatility approach beat the high-volatility approach as the percentage of wins varied. To create this chart, I used the worksheet shown in the sidebar, "High vs. low." (Note the odd scaling of the X-axis.) I ran the simulations over and over and plotted the high-low-average percentage of wins by a low-volatility system.

Excerpted from an article originally published in the December 1998 issue of Technical Analysis of STOCKS & COMMODITIES magazine. All rights reserved. © Copyright 1998, Technical Analysis, Inc.