On a day-to-day basis, markets trade in a volatile fashion around the trend. To better see the trend, traders use moving averages to filter the price action. This way, traders can gather important information regarding how the market is trading. For example, after a sharp rise or fall in the trend, the market may consolidate, trading in a narrow fashion and crisscrossing above and below the moving average. To better monitor this behavior, traders use price channels, which are designed to encompass the trading activity around the trend.
NOVICE TRADER
Bollinger Bands
by Stuart P. Evens
This indicator combines popular technical methods -- moving averages, support/resistance, and envelopes -- with statistical analysis to create a powerful technical analysis tool. Bollinger bands, used in combination with the relative strength index (RSI) to analyze a market, enables us to develop a method to enter and exit trades and review the historical results.

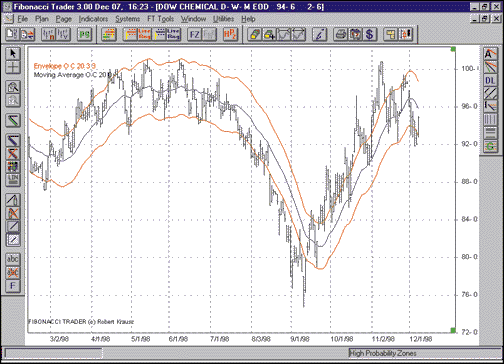
Bollinger bands are one such technical tool. Before we discuss Bollinger bands, however, let's have a quick look at some other methods that traders have used.FIGURE 1: ENVELOPES AROUND DOW CHEMICAL, USING FIBONACCI TRADER. Here, we see 3% envelopes around Dow Chemical. The center (blue) line is the 20-day simple moving average of closing prices, and both the upper and lower (red) lines make up the envelope. The upper line is a plot of the 20-day moving average plus 3% of the moving average's value, and the lower line is a plot of the 20-day moving average minus 3% of the average's value. Note how the price bars leave the envelope during periods of sharp downward and upward price movement.
Some technicians use moving averages with support and resistance lines to anticipate the price action of a stock. Upper resistance and lower support lines are first drawn and then extrapolated to form channels within which the trader expects prices to be contained. Some traders draw straight lines connecting either tops or bottoms of prices to identify the upper or lower price extremes, respectively, and then add parallel lines to define the channel within which the prices should move. As long as prices do not move out of this channel, the trader can be reasonably confident that prices are moving as expected.
J.M. Hurst's Profit Magic Of Stock Transaction Timing described a method of applying support and resistance theory to the moving average concept. Rather than using fixed points such as minor tops or bottoms to construct the channels, Hurst wrote about a method to add and subtract a fixed percentage of the daily moving average value to the moving average to create a band around the stock price. This group of indicators combines the two popular interpretations of stock price, the moving average and support and resistance.
Technicians call these envelopes or trading bands, and it is in this group that Bollinger bands belong. John Bollinger used statistical analysis to come up with a technical analysis tool to determine when to buy and sell. I will discuss envelopes in general and Bollinger bands specifically. We will also look at the logic behind these tools, how they are calculated and plotted, and how they can be used in trading. But before we do that, letÕs look into envelopes.
ENVELOPES
Envelopes consist of three lines: a middle one that is a moving average, and two others that form an upper and lower band, or envelope, around the price bars of a stock when plotted together on the same chart. The theory behind them is that the moving average represents the trend of the stock price, and the upper and lower lines indicate when temporary price extremes in that stock exist. When prices reach the upper line, or especially when they exceed the line, a warning is given for the possibility of a correction in the opposite direction -- that is, down. Likewise, when prices reach or exceed the lower line, an extreme level of selling is indicated, and it is reasonable to expect a movement up in prices.