The primary cycle in the stock market is the centerpiece of cycle analysis for traders as well as an important market timing tool for investors. Typically 17 weeks in length -- with a window, or orb, of four weeks -- the primary cycle is composed of smaller, short-term, subcycles known as phases. Further, the primary cycle itself is part of longer-term cycles. The primary cycle in stocks -- for that matter, in any financial or commodity market -- is the bridge between short-term and long-term cycles.
TRADING TECHNIQUES
Technical Studies And The Primary Cycle
by Raymond A. Merriman
Cycle analysis offers the opportunity to identify windows of potential market bottoms and tops. Technical indicators can be used to time entries and exits in the stock at key points in the cycle. How well does this concept work?

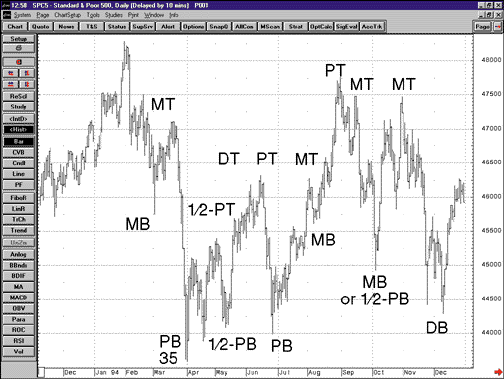
Before we analyze the primary cycle, let's look at another valuable approach for traders, that of multiple time frame analysis. One of the most important steps for accurate cycle analysis (and successful trading) is to look at the market through the relationship of multiple time frames. Whether the user is a technical or cycles analyst or trades only by means of pattern recognition, the rule is the same: Every time frame needs to relate to at least one other higher time frame, preferably two. Typically, successful traders who trade mostly by technical studies will look at the trend of three time bands -- a 30-minute chart, a 60-minute chart, and a daily chart. Those more oriented toward position trading, on the other hand, tend to examine daily, weekly, and monthly charts.FIGURE 1: S&P 500, 1994. Here's an example of labeling cycles on the chart of the S&P 500 during a broad trading range.
For the greatest probability of success, the shorter-term time frame must start moving in the direction of the trend of the longer-term time frame. If the daily trend is bullish, then using the intraday price bars as a guide for entering a short position would not be advisable. Our chances for success would be better if we waited for the intraday time frames to issue a buy signal, and then entered from the long side to be in accordance with the longer-term daily (or weekly) trend.
This comes back to the adage that the trend is your friend -- in this case, the trend of the next longest (or next two longest) time frames that relate to the cycle of preference. If that happens to be the daily chart, then it is most profitable to trade only in the direction of the trend shown by the weekly and/or monthly charts. (For more on this subject, see the works of Charles Drummond and Robert Krausz.)
In terms of cycles, the principle is similar. First, identify a cycle with which you are comfortable. Second, identify the sub-cycles, or phases, to the cycle. Then identify the next longest cycle of which it is a phase; tie in the cycle with which you are most comfortable with a cycle immediately below (shorter than) it, and with one immediately above (longer than) it.