NOVICE TRADER
Momentum And Relative Strength Index
by Stuart Evens
Last month, we examined the theory of price momentum. This time, we'll look at two common and popular indicators based on this theory, and how they can be used to enter and exit a market.
"Momentum oscillator" is a generic term used to refer to many different indicators, two of which are the relative strength index (RSI) and momentum indicators. Since J. Welles Wilder presented price momentum and the RSI in his classic New Concepts In Trading Systems, both indicators have become popular technical tools, and a discussion of each can be found in most current works on technical analysis.

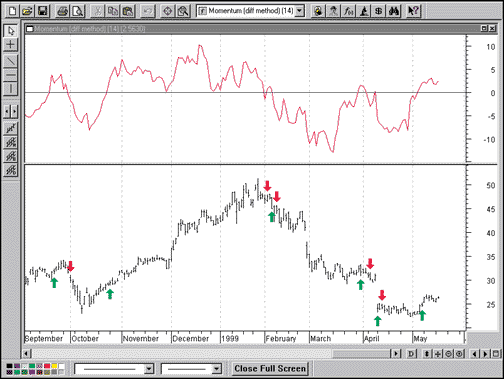
FIGURE 1: COMPAQ COMPUTER. The 14-day momentum indicator for Compaq is plotted using MetaStock. A custom formula that subtracts the close of 14 days prior to the current bar's close is used instead of the standard MetaStock formula for momentum. Indicator values using the custom formula can be seen here, oscillating around the zero line. Green arrows representing long trades and red arrows for short trades are displayed when momentum is above or below zero, respectively.
Both indicators can be used to enter and exit the market. We will do so and then take a look at the results, reviewing the method of calculation for each. (The sidebar "RSI calculation" details the RSI and its calculation and includes an Excel spreadsheet. For more detail on momentum, see the article in the July 1999 issue.)
To see how these indicators could be used to trade, I will outline two simple trading methods using each indicator and a method that combines both indicators. We will then compare historical results of each of our three trading methods. Finally, we will examine some of the basic considerations to determine the viability of a system.
Each of these points will be explained by backtesting each set of rules on five stocks: Coca-Cola (KO), Compaq (CPQ), Microsoft (MSFT), Intel (INYC), and Kellogg (K). We will use daily bars and the same period for each test of all five stocks. Each indicator will use a lookback period of 14 days, the period suggested by Wilder. Some markets or trading methods might produce better results with a different lookback period, so historical backtesting before risking money is very important.
Let's start our discussion by first looking at momentum.
MOMENTUM
Price momentum is the measure of a marketÕs speed or velocity of price change. One method to calculate the n-period momentum indicator subtracts the close n periods ago from the close of the current period. If both closing values are equal, the result will obviously be zero. If the current close is less than the close as of n periods ago, momentum will be negative. Conversely, if the current close is greater than the close n periods ago, momentum will be positive. This can be seen in the 14-day momentum plot for Compaq Computer shown in Figure 1. Because the standard MetaStock formula uses a different method to calculate momentum, a custom indicator was plotted using the difference method.
The interpretation of the momentum indicator we will use is to go long when its value rises above the zero line and to go short when dropping below the zero line. Figure 1 also shows arrows indicating some trades based on this criteria for Compaq using the 14-day RSI. The green arrows pointing up indicate long positions, while red arrows pointing down indicate short positions. These arrows were generated by MetaStock's System Tester, which we will use more extensively later.
Stuart Evens is a Staff Writer for STOCKS & COMMODITIES.
Excerpted from an article originally published in the August 1999 issue of Technical Analysis of STOCKS & COMMODITIES magazine. All rights reserved. © Copyright 1999, Technical Analysis, Inc.
Return to August 1999 Contents