NOVICE TRADER
Multiple-Indicator Techniques For Index Funds
by Andrew Abraham
Traders expect uncertainty in the markets; it comes with the territory of trading. But with the Standard & Poor's 500 hitting new highs after a gut-wrenching decline, is there more uncertainty today? Here's a set of multiple-indicator procedures for trading an index fund, complete with historical examples.
We have all heard market experts advise us to be long-term investors. However, if you began investing in 1973 or 1929, could you have held on long enough to earn a profit? It took approximately 25 years to reach levels seen prior to 1929 and approximately 12 to reach levels seen prior to 1973. Japanese investors have been waiting for a return to the highs of 39,000 seen in the Nikkei only a few years ago. While everyone should participate in equities, prudence is always warranted, because anything can happen. As easily as the Dow Jones Industrial Average (DJIA) could go up to 25,000, it could also go down to 5,000.
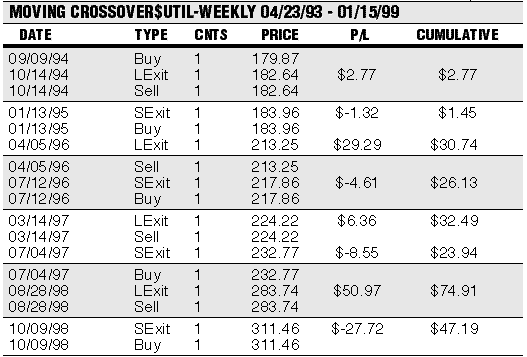
FIGURE 1: MOVING CROSSOVER. Here are the results for the moving average crossover system during the period of April 23, 1993, to January 15, 1999.So how do we participate in this super-bull stock market while keeping control of our risk? One way is to use a set of tested procedures as a guide. I have learned that this is a wise thing to do from my years as a commodity broker for a firm that executes mechanical systems for clients. Combine a few systems to meet your own risk tolerance and reward expectations. Simple systems, rather than complex, usually stand a better chance of continuing to achieve positive results. You may also find it advisable to build your system using multiple time frames -- days, weeks, months.
To trade the market, I use index funds. I like to trade a stock index by the signal given by a group of trading systems. I trade the Rydex Nova fund, a no-load fund, which mimics the movement of the Standard & Poor's 500 index. I mix various trading systems from other market technicians with some of my own. I have tested more than 60 different systems and have seen how they have held up over different market conditions. The systems I use are based on breadth -- new highs, new lows, advancing issues, declining issues, volume in advancing issues, and volume in declining issues -- as well as price momentum, market sentiment, and interest rates.
MARKET SENTIMENT
Sentiment tracks traders' expectations of the market. One such indicator is Market Vane, which is published on a daily basis. This indicator lists, in percentage terms, the number of bullish investment advisors for many of the commodity markets as well as the stock market. I use the weekly numbers and compare them to the historical figures, looking for an extreme. The goal here is to step away from the crowd. If everyone is bullish and sentiment numbers are reaching the higher percentile ranges, that's a warning signal. I consider this indicator a contrary one. If I see this situation form, I will scale back my exposure, and hopefully my risk. After a strong downward move in the market, when bullish consensus is low, I want to be contrary to the crowd and consider increasing my exposure.
Andrew Abraham is a trader and a Commodity Trading Advisor with Angus Jackson. He may be reached via E-mail at info@trendrider.com.
Excerpted from an article originally published in the September 1999 issue of Technical Analysis of STOCKS & COMMODITIES magazine. All rights reserved. © Copyright 1999, Technical Analysis, Inc.
Return to September 1999 Contents