REAL WORLD
The Dead Cat Bounce
by Thomas Bulkowski
If you trade stocks long enough, you might have an event take your stock down 25% to 70% in a single session. Then the situation gets grim. Here's a review of the dead cat bounce chart pattern and a strategy to minimize any additional losses.
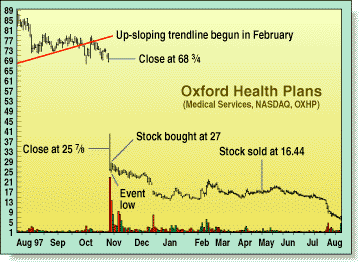
Warren was a novice investor who'd never suffered some of the ups and downs of a volatile market. He called me shortly after the market closed one day, and he was so excited, it took me a moment to recognize his voice: "Oxford just went from 69 to 26. That's a decline of 62%! I'm thinking of buying because after such a large drop it's just got to bounce."

FIGURE 1: OXFORD, WITH BARELY A BOUNCE. This 42-7/8 decline hardly bounced at all before continuing down. The 62% one-day decline was only the start of its problems. The stock reached a low of 5-13/16 for an additional decline of 78% (92% total).
He wanted to buy into the situation that can be seen in Figure 1. My reply? "If you don't get out within a week, you'll lose money," I told him.
Choosing not to heed my words, Warren bought the stock the following day at 27 and watched it close lower at 25-3/8. He was counting on the stock bouncing to 30 for a net gain of about 10%. Did he place an order to sell at 30? No. Did he place a stop-loss order with his broker or even consider a selling point? No. As a novice trader, he was unfamiliar with such concepts.
A week later, the stock reached a new yearly low of 24 and closed at 25-5/16. Warren decided to hold on, still hoping for a bounce, despite the odds. In our conversations we talked about a number of stocks, but never Oxford; it was too painful a subject for him to broach. On April 24, 1998, he finally threw in the towel, selling the stock at 16-7/16 for a net loss of 40%.
LESSONS LEARNED
Did he learn from this experience? Not yet. Consider Figure 2, the other stock he purchased (CompUSA). The buy was at 36-7/8 in mid-October 1997 on the expectation that the stock would move up smartly as Christmas approached. He planned on selling the stock at the start of the new year to capture his gains.
Instead, he bought one day after it reached a yearly high. Warren wanted to make a momentum play: Buy high and sell higher. Nine trading days later, however, the stock reached a low of 27-3/4 for a paper loss of 25%. Again, no word on a stop-loss point or money management of any sort. He persevered, however, and the stock quickly recovered to post a new high of 38 on December 1.
Thomas Bulkowski uses his software engineering skills to further his investment activities.
Excerpted from an article originally published in the September 1999 issue of Technical Analysis of STOCKS & COMMODITIES magazine. All rights reserved. © Copyright 1999, Technical Analysis, Inc.
Return to September 1999 Contents