NOVICE TRADER
Stochastics
by Stuart Evens
As originally introduced by George Lane, the classic stochastic oscillator is not a normalized relative strength indicator, like most other momentum oscillators. However, it does use closing price in its calculation, but in a way slightly different from other oscillators. Here's a refresher for the veteran traders and an introduction for the novices.
The stochastics oscillator was originally introduced by George C. Lane in STOCKS & COMMODITIES in 1984. Since then, it has become a popular indicator, included in most technical analysis software programs. That, combined with the widespread use of the personal computer, has made stochastics an easy indicator to use.

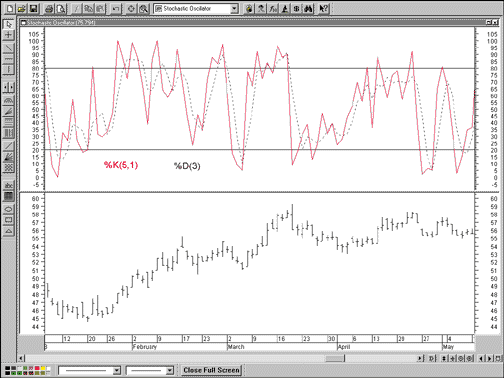
FIGURE 1: CATERPILLAR. Here is the daily chart for CAT from December 1997 to April 1998 with stochastics plotted. The red solid %K line uses a five-day range with no slowing. The blue broken %D (signal) line is a three-day simple moving average of %K.
To gain a more complete understanding of the oscillator, let's look at the idea behind stochastics, then at how it is calculated and interpreted. (To examine historical results from backtesting the indicator on a number of securities, see sidebar, "Historical testing in stochastics.")
IN THEORY
Stochastics is based on the relative position of a security's closing price within the trading range during past periods. Generally, during a market downtrend, the closing price tends to be at the low end of the trading range over a selected period. Conversely, during uptrends, the close tends to be at the upper end of the trading range.
The relative position of the close in the range during market transitions is also significant. As a market nears the end of a downtrend and is reversing, closing prices shift from the lower part of the range to the higher part of the range.
The reverse is true at market tops. The close shifts from the upper part of the range to the lower. Stochastics measures and represents this relationship between the close and the range. Figure 1 shows stochastics plotted for the daily chart of Caterpillar during the period December 1997 through April 1998 using MetaStock. This figure shows stochastics made up of two lines, the red solid %K line (the faster version) and the blue broken %D line (the slower version). The two black horizontal lines at values of 80 and 20 identify overbought and oversold levels.
Like most indicators, the time period and the number of periods chosen to calculate stochastics affect the appearance and responsiveness of the two lines. Generally, future stock price indications are given by combinations of one or more of the three following methods:
Method 1 The position of the lines relative to each other
Method 2 The lines relative to specific levels (80 and 20)
Method 3 Divergence between stochastics and prices.
Trades today are made based on any one or combination of these criteria, but originally, Lane opined that divergence was the only valid signal on which to trade. The other two criteria were used to confirm divergence, or as a warning that an important signal was near. As Lane first presented stochastics, a valid signal occurred only when a divergence between price and stochastics was followed by a crossing of the %K and %D lines.
In addition to different interpretations and uses of stochastics, there are also different methods of calculation. The method discussed here will be consistent with MetaStock, unless otherwise noted.
Stuart Evens is a Staff Writer for STOCKS & COMMODITIES.
Excerpted from an article originally published in the September 1999 issue of Technical Analysis of STOCKS & COMMODITIES magazine. All rights reserved. © Copyright 1999, Technical Analysis, Inc.
Return to September 1999 Contents