IQC.COM
www.iqc.com
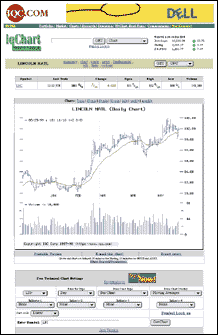
IQC.com is a data source for the technically oriented investor. IQC Corp. offers free stock charts, quotes, stock scans, and market information. The Website is straightforwardly laid out and easy to navigate.

The homepage gives you today's index data and a five-minute chart of the DJIA, with news headlines below. View a market summary with charts of indices, or enter a symbol to display a quote or chart. In keeping with IQC's technical focus, two types of free quotations are available: Detailed quotes include a complement of technical indicators, while basic charts are quick.
Timeframes range from five-minute to hourly, daily, weekly or monthly. Charts can be printed or E-mailed. From the chart settings, you can display a bar/candlestick/line chart; overlay prices with Bollinger bands, moving averages, or linear regression; and plot up to four indicators, such as MACD, momentum, and others.
Links to news stories and other Websites are available. Java display is also an option.
IQC.com's search engine locates stocks that meet the criteria set by the user. Price, volume, and fundamental criteria can be entered to scan the entire stock database for matching characteristics.
An education area offers explanations and definitions of technical indicators, candlesticks, numerous chart patterns, and terminology. A bookstore offers further reading. Register for access to the My Portfolio area, which includes access to the message board.
A demo of IQ Chart, a subscription-based service from IQC, is available for real-time, automatically updating technical charts and quotes. IQ Chart is a separate service from IQC.com.
CLEARSTATION
www.clearstation.com
ClearStation focuses on helping the investor to identify and interpret stock trends through an emphasis on MACD and stochastics. ClearStation also encourages interaction with other registered members for discussion and investing ideas. Through charts, daily computer-generated stock ideas, and education features, ClearStation brings technical analysis to the online investor. Charting is a free area; other areas are also free but require registration.

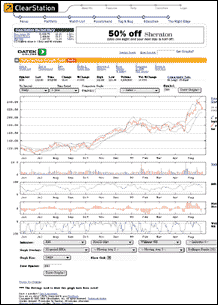
From the homepage, you get index charts, a market summary, and excerpts from today's news and commentaries. Input a symbol to get color-coded, easy-to-read graphs. Automatically plotted is a daily price chart with a 50-day and 13-day exponential moving average. Displayed below the chart are volume, MACD, MACD histogram, and stochastics. The MACD gives you a fast and slow line with trending indicators. Even volume is color-coded by up and down days. ClearStation's unique red and green stripes above the chart show trending action. Advanced users can add support, resistance and trendlines to charts.
A beta-version interactive graphing tool at the site allows you to customize charts and add additional technical indicators. Plot an equity and overlay it with another stock or index for comparison. Alternatively, plot up to four technical studies; overlay price bars with up to three moving averages and Bollinger bands; change the display size; and change the tick interval from one minute to weekly and the charting span from one day to five years.
In other features and areas at the Website, ClearStation offers an automated trend detection system that scans the market throughout the day to create dynamic lists of stocks entering price trends or experiencing fundamental events such as earnings surprises.
Originally published in the September 1999 issue of Technical Analysis of STOCKS & COMMODITIES magazine. All rights reserved. © Copyright 1999, Technical Analysis,Inc.
Return to Table of Contents