INTERVIEW
On The Opening Bell
David Vomund Of AIQ
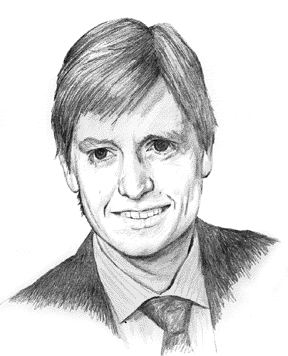
David Vomund of AIQ Systems wears a few hats, chief of which is his positions as chief analyst of artificial intelligence–based charting software developer AIQ Systems and the editor of AIQ's newsletter, The Opening Bell. Not only that, Vomund is also president of Legarza Vomund Investment Management, a registered investment advisory firm where he manages aggressive blue-chip portfolios. Under this money management program, Vomund utilizes his growth investing strategy while concentrating on a limited number of well-known companies; for the first half of 1999, his fund increased 44%. Vomund also publishes the weekly Vis Alert.com E-mail newsletter, which covers market timing, industry sector rotation, and stock selection. Timer Digest, an independent service that tracks market timing performance, rates Vomund's market timing as one of the 10 best for the five-year period ended December 31, 1998. STOCKS & COMMODITIES Technical Editor John Sweeney spoke with Vomund via telephone on July 22, 1999, on various topics such as artificial intelligence, why point and figure charts by hand are still a good idea after all this time, and why mechanical systems are still his preference.

ILLUSTRATION BY CARL GREEN
How did you get started in technical analysis?
I was an economics major in college, and I ended up getting a job for a small company in the Bay Area that published investment newsletters. I got an Mba in night school while I was working there. So during the day I was learning technical analysis, how indicators work, how to interpret charts, and then in the evening, I'd go to class and learn that the markets are totally efficient and you don't have to do any technical research. You just throw a dart or buy an index fund because, we were told, the markets are a random walk.
How did you deal with that?
The more I studied technical analysis, the more the theory of a random walk was really disproved for me. The markets are efficient, there is no doubt about that, but they're certainly not totally efficient.
I noticed there were some money managers and mutual funds that did well pretty consistently. I realized that could be an anomaly; there's always going to be that part of the bell curve. But I also knew that there were other money managers and newsletter writers that do poorly consistently.
If the market were totally efficient, that wouldn't happen.
There are people consistently on the wrong side on their guesses on stocks and on the market, and that would not happen if a market were totally efficient. So between working in the real world during the day and then going to school at night, I became a firm believer that the market is very efficient, but not totally so.
What do you mean by "totally efficient"?
I mean that all available information is factored into price so an analysis of the stock adds no useful information. It assumes that the analysis that you perform has already been performed by others so it is factored into the price. In an efficient market, you'll do just as well picking stocks by throwing a dart. In a totally efficient market, you simply buy index funds because that would be the cheapest method of being diversified in the market.
What did you do after that?
I left the newsletter publisher in 1991 and more or less fell into Aiq after graduating from the Mba program. I was thumbing through the help-wanted ads and Aiq was advertising for a position in their technical research department. At the time, Aiq was just starting to come out with a product that was very in-depth on the industry group rotation. I was familiar with the indicators, because in the years of working for the newsletter publisher, I had learned about how technical indicators work and had also learned quite a bit about technical analysis. It worked out very well in that regard.
With the newsletters, you were primarily concerned with indicators. Weren't you doing charts too?
There were charts, but what I learned most was how things worked. I learned about point-and-figure techniques. Even though we could get computerized point-and-figure charts at that point -- though I think it was still pretty new at that point -- we did a lot of it by hand, which helped to understand how the technique works.
What about the indicators?
It took me longer to get comfortable with technical indicators, knowing what they measure and how they are calculated, than to learn chart interpretation. I'm a visual person, so learning how to identify chart patterns as they develop came easily.
That makes it sound as if patterns were a major part of my analysis, but that wasn't the case. When I do my own analysis, I like to search for patterns like triangles and breakouts. Trendline analysis is important to me, especially when the trendline is tested on several occasions.
There is a real danger in overoptimizing. When you overoptimize, what works in the past doesn't work in the future. When you think of artificial intelligence, you tend to think of self-learning and changing and optimizing as time goes on. -- David Vomund
Excerpted from an article originally published in the October 1999 issue of Technical Analysis of STOCKS & COMMODITIES magazine. All rights reserved. © Copyright 1999, Technical Analysis, Inc.
Return to October 1999 Contents