October 1999
TRADERS' TIPS
You can copy these formulas and programs for easy use in your spreadsheet or analysis software. Simply "select" the desired text by highlighting as you would in any word processing program, then use your standard key command for copy or choose "copy" from the browser menu. The copied text can then be "pasted" into any open spreadsheet or other software by selecting an insertion point and executing a paste command. By toggling back and forth between an application window and the open Web page, data can be transferred with ease.
This month's tips include formulas and programs for:
TRADERSTATION / SUPERCHARTS
or return to October 1999 Contents
 TRADESTATION/SUPERCHARTS
This This month in Traders' Tips we look at the MACD of the relative strength (MACD RS) between two instruments. This indicator is fairly easy to recreate in TradeStation's PowerEditor using the built-in MACD function.GO BACKIn the EasyLanguage for this indicator, relative strength is calculated first. Once the relative strength value has been obtained, then the Macd function is used to calculate the differential line for Plot1. Both the XAverage and the MACD functions are used in Plot2 for the calculation of the signal line. The suggested format for this indicator is specified after the EasyLangauge.
Here's the EasyLanguage that would be used to recreate the MACD of the relative strength:
Name: MACD RS
Type: Indicator
Inputs: Length(10), FastMA(12), SlowMA(25), MacdMA(9); Variable: RSFago(0), RSF(0), RS(0);RSFago = Close[Length] of Data1 / Close[Length] of Data2; RSF = (Close of Data1 / Close of Data2) * 100; RS = RSFAgo / RSF;Plot1(MACD(RS, FastMA, SlowMA), “Diff”); Plot2(XAverage(MACD(RS, FastMA, SlowMA), MacdMA), “Signal”);Style:Plot Name Type Color Weight Plot1 Diff Histogram Blue Thinnest Plot2 Signal Line Red ThinnestScaling: Screen
Note: To apply this indicator to a chart, you will first need to create a multidata chart. The typical chart setup for this indicator would have an equity defined as Data1 and an index defined as Data2. Once you have set up the chart with both instruments, you can then apply the MACD RS indicator to the chart.This EasyLanguage code is also available from Omega Research's Website. The name of the file is MACDRS.ELS. Note that all Traders' Tips posted at the Omega Research Website can be utilized by both TradeStation and SuperCharts. When possible, the posted analysis techniques will include both QuickEditor and PowerEditor formats.
-- Gaston Sanchez, Omega Research Inc
800 422-8587, 305 270-1095
Internet: https://www.omegaresearch.com
METASTOCK
The MACD of relative strength indicator can easily be recreated in MetaStock 6.5 or higher. In MetaStock, select "Indicator Builder" from the Tools menu. In the Indicator Builder, click "new" and enter the following formula:GO BACK
Name: MACD of relative strength
Q:=Input("Relative Strength Time Periods",3,100,14);
z:=Wilders(If(ROC(C,1,$)>0,ROC(C,1,$),0),LastValue(Q));
y:=Wilders(If(ROC(C,1,$)<0,Abs(ROC(C,1,$)),0),LastValue(Q));
ZY:=Z/Y;
RS:=100-(100/(1+ZY));
RSMACD:=Mov(RS,12,E)-Mov(RS,25,E);
Signal:=Mov(RSMACD,9,E);
RSMACD;
Signal
Next, click OK and close out of the Indicator Builder. Open a chart and plot the new formula by dragging it from the Indicator QuickList or by clicking "indicators" from the Insert menu. Both the Macd line and the signal line will be plotted.If you prefer to view the RS Macd line in a histogram style, in MetaStock 7.0, select the RS Macd line and use the Style toolbar to change it to the histogram style. In MetaStock 6.5, plot the following formula:
Name: MACD of relative strength
Q:=Input("Relative Strength Time Periods",3,100,14);
z:=Wilders(If(ROC(C,1,$)>0,ROC(C,1,$),0),LastValue(Q));
y:=Wilders(If(ROC(C,1,$)<0,Abs(ROC(C,1,$)),0),LastValue(Q));
ZY:=Z/Y;
RS:=100-(100/(1+ZY));
RSMACD:=Mov(RS,12,E)-Mov(RS,25,E);
RSMACD;
Next, select the RS MACD line and use the Style toolbar to change it to the histogram style. To plot the signal line, drag "moving average" from the Indicator QuickList and drop it on top of the RS MACD line. When the moving average is placed on top of the RS MACD line, the RS MACD line will change color and the status bar will say "Calc moving average using MACD of relative strength" to signify that the RS MACD will be used to calculate the moving average. Select "9" for the time period and "exponential" for the method, then click OK.-- Cheryl Elton, Equis International
301 662-7950
E-mail: wardsystems@msn.com
Internet: https://www.neuroshell.com
NEUROSHELL TRADER
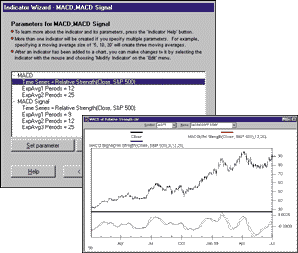
Here The relative strength and MACD indicators are included in the 800-plus technical indicators built into NeuroShell Trader and are easily combined using NeuroShell Trader's Indicator Wizard.GO BACK
FIGURE 1: NEUROSHELL TRADER. Set up the MACD of relative strength using NeuroShell Trader's Indicator Wizard.FIGURE 2: NEUROSHELL TRADER. Here's the MACD of relative strength displayed on a NeuroShell Trader Chart.
To insert the MACD of relative strength into a NeuroShell Trader chart, follow these steps:1) From the Insert menu, select the "new indicator" menu item.
2) Select the "price momentum indicators" category and press the Next button.
3) Select the "MACD" and "MACD Signal" indicators and press the Next button.
4) If needed, change the short- and long-term smoothing periods of the MACD from the default values of 12 and 26, or change the signal, short-term, and long-term smoothing periods of the MACD signal from the default values of 9, 12, and 26.
5) Change the default, "closing prices," to the relative strength:
a) Select the "time series" parameter (Figure 1).
b) Press the "Set parameter" button.
c) Press the "indicator" button.
d) Select the "time series" category and press the Next button.
e) Select the relative strength indicator.
f) Change the "Time series #2" parameters to the desired comparison time series by pressing the "Set parameter" button followed by the "Other instrument data ..." button.
g) Press the "finished" button to add the relative strength to the Macd indicator.
6) Press the "finished" button to add the indicator to the chart (Figure 2).
-- Marge Sherald, Ward Systems Group
301 662-7950, E-mail: wardsystems@msn.com
https://www.neuroshell.com
TECHNIFILTER PLUS
TechniFilter Here's a TechniFilter Plus implementation of the MACD of relative strength.GO BACKThe normal MACD difference line formula in TechniFilter Plus is CX12-CX25. To perform the calculation on some other quantity, such as relative strength, you would replace the "C" in this formula with that quantity. The formulas seen here do this with a relative strength to an index calculation. Make sure you substitute your index for the DJ30 in the formula.
Here is a comment on computing a relative strength to an index: You can do such calculations by just dividing the issue's price by the index value, charting this ratio over time. But this calculation is not normalized, meaning its range of values will vary from issue to issue. For this reason, the calculation is usually normalized by dividing by the same ratio at some other time.
The calculation below divides by the value of the ratio on the first day of data loaded. So the calculation begins at 100 for every issue. If you change the TY00 to TY000, you will divide by the ratio at the last date known, making the calculation end at 100. Finally, if you change TY00 to TY100, each day you divide by the ratio's value 100 days earlier.
MACD difference line of relative strength
NAME: macdrs
SWITCHES: multiline
FORMULA: [1]: 100 * ( C / ~<DJ30>~ ) / TY00
[2]: [1]X12 - [1]X25MACD signal line of relative strength NAME: macdrsx SWITCHES: multiline FORMULA: [1]: 100 * ( C / ~<DJ30>~ ) / TY00[2]: ( [1]X12 - [1]X25 )X9
These formulas and program updates can be downloaded from Rtr's Website. Release 8.2 of TechniFilter Plus is now available.-- Clay Burch, RTR Software
919 510-0608
E-mail: rtrsoft@aol.com
Internet: https://www.rtrsoftware.com
SMARTTRADER
To recreate an MACD of relative strength indicator in SmarTrader requires only three study rows (Figure 3).GO BACK
FIGURE 3: SMARTRADER. Calculating the Macd of relative strength in SmarTrader requires only three study rows.
First, add the RSI study of the Close set to the default, 14 periods. Then add the Macd line, which has the default parameters of 12 and 26 days. Switch the row to calculate on to RSI. This calculates the first two exponential moving averages (EMA) and yields the difference. Then add the signal row, which is set to the default of 9 and yields EMA of MACD.-- Jim Ritter, Stratagem Software International
504 885-7353
E-mail: Stratagem1@aol.com
Internet: https://www.stratagem1.com
WAVEWI$E MARKET SPREADSHEET
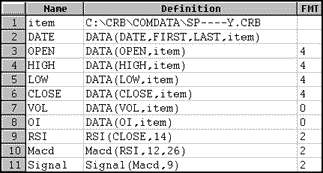
The following Wave wi$e formulas show how to compute the MACD of relative strength. Relative strength provides information on the performance of one security versus an index. Our review of MACD of relative strength on IBM versus the S&P 500 stock index provided us with no meaningful trading strategy.GO BACK
A: DATE         @TC2000(C:\TC2000\DATA,SP-500,STANDARD & POORS 500,D)
B: SPCLOSE
C: DATE         @TC2000(C:\TC2000\DATA,IBM,IBM,D)
D: IBMCLOSE
E: RSF  100*IBMCLOSE / SPCLOSE
F: period       14
G: RT   (IBMCLOSE[-PERIOD] / SPCLOSE[-PERIOD]) / RSF
H: Macd         @EAVG1(RT,12) - @EAVG1(RT,25)
I: Signal       @EAVG1(MACD,9)
J:
==========End Formulas
-- Peter Di Girolamo, Jerome Technology
908-369-7503
E-mail: jtiware@aol.com
Internet: https://members.aol.com/jtiware
All rights reserved. © Copyright 1999, Technical Analysis, Inc.
Return to October 1999 Contents