NOVICE TRADER
Getting Started With Options Using Protected Positions
by Joe Demkovich and Eugene Theriot
If you're bullish or bearish, you don't need to expose yourself to the full risk of the underlying stock. Instead, take a protected position using option spreads. Here's a followup on last issue's article on options.
Last month, we described how to get past all the complexity facing a novice options user. We showed a simple, conservative options technique -- writing covered calls -- that you could use to increase the returns on your portfolio. This month, we'll show you two other option uses that are applicable when you have a definite outlook on the direction of a stock. The first is to buy a call and the second is a more conservative method referred to as a spread. As we will see, buying the call has a high potential reward but requires a large move in the stock to be profitable. The spread has a limited potential but will be profitable as long as the stock price doesn't go down too much. We hope that the articles together will motivate you to learn about options with little cost just by spending some time paper-trading.

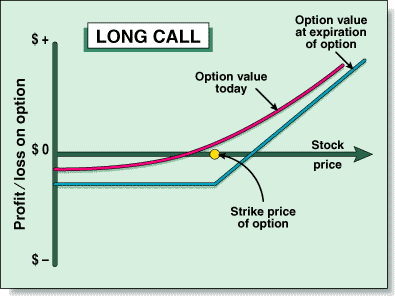
FIGURE 1: LONG CALL. When you buy a call (that is, you are long the call itself), you'll make money when the stock price at the option's expiration is above the strike price plus the premium you paid for the stock.
LONG CALL
Suppose you decided that AT&T was about to break out and had a good chance of going up substantially between now and January 20, 2000. (The stock price as of May 25, 1999, was $57.56.) You could just buy AT&T, but you'd be completely exposed to any fall in price. You could also buy a call and risk a complete loss of your investment if the option expired with AT&T below the call's strike price (Figure 1).
Figure 2 depicts the theoretical prices of options that may be available for a stock using the Black-Scholes pricing mode. Most any option program can deliver much of this information. We've shaded the call option we would consider for the AT&T position: the January 2000 LEAP (long-term equity anticipation security). Just below the price at the upper left are three volatilities, the annual volatilities calculated using the last 100, 50, and 20 days of price change. Since the volatilities have been moving down, the options should be cheaper than they have been because less premium will be charged.
We expect many of the January options to be available because they are LEAPs. We like the Jan '00 60 with an expected price of 7.78 (7.35 is the fair model price, and 0.43 is a typical increment that we would to pay for the ask price or lose for the bid price). The January options are symbol A, and there are 241 days to expiration. One standard deviation of the price volatility for this stock for this period is 32.5%.
The option needs a move in the underlying equity to $67.78 to break even at expiration. Then the stock will be $7.78 in-the-money (higher than the strike price) and the option will be worth $7.78, exactly what we think we can buy it for now. Unless the stock moves to $60 at expiration, it will expire worthless and we will lose all of our money if we still hold the option. However, if the stock makes a really big move by expiration, say, 32.5% to $76.27, the option will be worth $16.27 compared with the $7.78 that we think we will have to pay to buy the option now. The 32.5% stock rise is one standard deviation of the volatility of the stock, shown in the left margin of the figure and computed by taking the annual volatility and multiplying by the square root of the ratio of 241 to 365 days in a year.
Joe Demkovich and Gene Theriot are partners in an options investing business. Demkovich has been teaching investing courses for several years and is a retired IBM manager, and Theriot is a retired computer engineer. They can be reached via E-mail at joeandgene@att.net or on the Internet at https://JoeAndGene.home.att.net. Option analysis tools are available for download from their Website.
Excerpted from an article originally published in the November 1999 issue of Technical Analysis of STOCKS & COMMODITIES magazine. All rights reserved. © Copyright 1999, Technical Analysis, Inc.
Return to November 1999 Contents