TRADING TECHNIQUES
Coding Candlesticks
by Viktor Likhovidov
Up to now, interpreting candlesticks was more art than science. Now, art turns to science with a quantitative approach you can code.
Japanese candlestick charting is a popular method with which to visualize market price dynamics. Usually, candlestick charting is used in concert with other indicators to gauge market activity, but as a quantitative approach, technical analysis would be best served with quantitative rules for reading candlestick charts. Here's a simple method by which to assign digital codes to candlesticks. You'll see that the codes agree with the basic principles of technical analysis and may be used to construct a class of new indicators.

FIGURE 1: CODE STRUCTURE. Seven binary digits are needed to code the candlestick formations. Color takes one digit and the rest take two digits each.
My coding scheme is built on the common interpretation of candlestick charts. In particular:
- The color of the candlestick is its most important characteristic, so it has the highest weight in the code. White candles are bullish and black candles are bearish.
- The opening and closing prices of the candlestick are the most important of its four levels (open, high, low, close), and this is reflected in that the size of a candlestick's body corresponds to the positions of the binary code directly after its color.
- The weight of each candlestick's element (body, upper shadow, lower shadow) depends on its size.
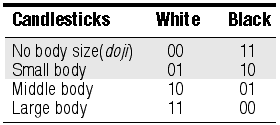
The digital code attributed to the candlestick is defined as the sequence of seven binary digits (Figure 1). The first binary digit of this code represents the color of the candlestick: one (1) for a white one, and zero (0) for a black one. The second position, composed of two binary digits, denotes body size, depending on the first digit, or color, of the body:

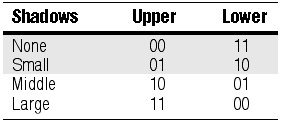
The third and fourth positions (each consisting of two binary digits) code the sizes of upper and lower shadows, respectively:

This sequence of binary digits is the binary representation of an ordinary decimal number, and this number is the code of the particular candlestick. (A doji candlestick -- which has zero body size -- is white if its upper shadow is longer than its lower shadow.) So, in all, seven digits are needed to code the candlestick formations: color takes one digit, while the other three -- body, upper shadow, and lower shadow -- take two digits each.
Figure 2A shows some different shapes of candlesticks for examples. Figure 2B diagrams how the coding is done. The codes for Figure 2A's candlesticks are computed here as examples:
Viktor Likhovidov, a financial analyst and consultant based in Vladivostok, Russia, performs research in the areas of pattern recognition, neural networks, and mathematical methods in currency markets analysis. He can be reached at lita@math.dvgu.ru.
Excerpted from an article originally published in the November 1999 issue of Technical Analysis of STOCKS & COMMODITIES magazine. All rights reserved. © Copyright 1999, Technical Analysis, Inc.
Return to November 1999 Contents