TRADING TECHNIQUES
Trading The Opening Gap
by Stéphane Reverre
Is it possible to profitably trade a gap opening from the previous close? Here's one trader's test of that idea using Dow Jones Industrial Average (DJIA) stocks as the subjects.
Profitably buying an opening dip or selling an opening pop, depending on the size of the move, is possible, but it's not easy money. I systematically tested taking a position in the morning following a gap at the open and unwinding the position at the close of the same day, regardless of profitability. What I found was that the strategy, though not hugely profitable, was consistently profitable.

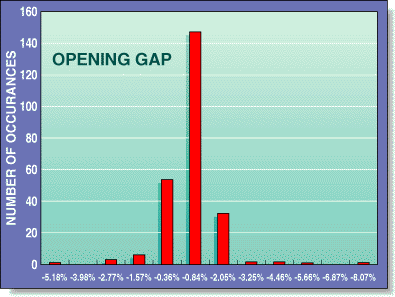
FIGURE 1: THE OPENING GAP DISTRIBUTION, 1998-99. Here, the distribution of the opening gap shows that most opening moves are smaller than 1%.
Here's an example of how you could do the analysis yourself, complete with code (see Traders' Tips).
CONVENTIONAL WISDOM
If nothing is happening, there is no reason why a stock's price would jump one way or the other. Therefore, mild price movements are the general expectation. What I wanted to capture were abnormal movements -- above a certain trigger level -- because, in those cases, I expected a correction.
I could not predict the speed of the correction, but still, I reasoned, if unwarranted gaps were spotted quickly, it should take at most a few days for investors to realize that a particular stock had been unduly inflated or hammered. Because I restricted myself to a single trading day, I estimated -- or at least hoped -- that this correction would be initiated quickly and completed at the end of a single session.
THE GAP
First of all, what does the close-to-open gap look like? The closeup illustration below shows the gap between the close and the open -- and the direction to trade. The size of the gap to use as a trading opportunity is the key question.
Figure 1 shows the distribution of gap sizes for General Electric [GE] for one year. (See "Measuring the gap" in the sidebar "Technical concepts" for details.) The narrowness of the distribution suggests that GE tends to open more often around its previous close. I have found that this holds true for a number of stocks.
In the context of a narrow distribution, exceptional events are an abnormal behavior at the open and should be easily identifiable, because opening prices tend to vary less. For specifics, note Figure 2. This histogram is a closer look of Figure 1, and it shows that most of the opening gaps are less than 1%. In fact, 212 of 250 points are within one standard deviation around the average -- that is, between -1.09% and 1.15%.
Stéphane Reverre is working toward an MBA at Harvard Business School. Previously, he worked at a French leading financial institution as an equity derivatives trader in Tokyo and New York. He can be reached at sreverre@hotmail.com.
Excerpted from an article originally published in the November 1999 issue of Technical Analysis of STOCKS & COMMODITIES magazine. All rights reserved. © Copyright 1999, Technical Analysis, Inc.
Return to November 1999 Contents