November 1999
TRADERS' TIPS
You can copy these formulas and programs for easy use in your spreadsheet or analysis software. Simply "select" the desired text by highlighting as you would in any word processing program, then use your standard key command for copy or choose "copy" from the browser menu. The copied text can then be "pasted" into any open spreadsheet or other software by selecting an insertion point and executing a paste command. By toggling back and forth between an application window and the open Web page, data can be transferred with ease.
This month's tips include formulas and programs for:
TRADESTATION / SUPERCHARTS METASTOCK BIOCOMP PROFIT NEUROSHELL TRADER TECHNIFILTER PLUS SMARTRADER WAVEWI$E MARKET SPREADSHEET or return to November 1999 Contents
 TRADESTATION/SUPERCHARTS
This month's focus in Traders' Tips is my gap-trading system presented in "Trading The Opening Gap" in this issue.
Here is an Omega Research EasyLanguage script for the gap-trading system. For practical reasons, this system cannot be described as an EasyLanguage system, so it must be programmed as an indicator. The value of this indicator is the cumulated profit of trading the system every day within the period considered.
In addition, day-to-day profitability can be explored with a ShowMe study. A red dot indicates a loss, a blue dot a profit. A dot at the high of the day indicates a gap up (that is, a short position), a dot at the low of the day is a gap down (that is, a long position).
GO BACKinputs: gap_up(1), gap_down(1); variables: gap(0);gap = 100*(open - close[1])/close[1];if gap >= gap_up then begin if close <= open then plot1(high, "UpGap", blue) else plot1(high, "UpGap", red); end;if gap <= -gap_down then begin if close >= open then plot2(low, "DnGap", blue) else plot2(low, "DnGap", red); end;-- Stéphane Reverre
 METASTOCK
Here is the gap-trading system code for use in Equis International's MetaStock software. For practical reasons, the system has been defined as an indicator rather than a system, showing the cumulated profit.GO BACKdn:= 1.0; up:= 1.0;gap:= 100*(OPEN - Ref(CLOSE, -1))/Ref(CLOSE, -1);prf:= If(gap>=up, OPEN-CLOSE, If(gap<=-dn, CLOSE-OPEN,0));Cum(prf);-- Stéphane Reverre
 BIOCOMP PROFIT
In "Trading the Opening Gap," Stéphane Reverre introduces the possibility to profitably trade based on the gap between a security's open and the previous closing price. While BioComp Profit is an end-of-day marketing timing system, you can easily recreate a similar system that capitalizes on Reverre's techniques for trading end-of-day.
Start BioComp Profit and create a new system. Exit the "Build a new system" wizard and import the date, open, high, low, and close of the security of interest. We used the S&P 500 continuous futures contract.
Open the data transformation window and perform the following steps:
1. Make copies of the Open and Close price series.This will create the indicator discussed in Reverre's article.
2. Select the copy of Close and use the Lead/Lag function to shift it -1 periods.
3. Select the shifted Close and the Open price series and use the Diff transform to take their difference.
4. Select this result and the shifted Close and use the Ratio transform to compute their ratio with the shifted Close in the denominator.
5. Take this result and use the MULT function to multiply it by 100.
6. Delete all intermediate results using the delete button.
Since Reverre's system trades on the open, use the change in the opening price, shifted two days into the future, as your predicted variable. Set BioComp Profit's and the NGO's trading parameters to trade the open as well. Close the data transformation window and save your system. To build neural network models optimized for equity performance, press F5. After 100 alternative models have been built, press F6 to bring the top performers into BioComp Profit and evaluate their equity performance on out-of-sample data (that is, data not used to create the models).
Our analysis on the S&P 500 using only this one indicator showed that you can consistently recreate market timing systems in BioComp Profit that outperform the buy-and-hold approach by about 120% on out-of-sample data. This suggests that this gap-trading indicator has value and should be considered when you are building your timing systems.
BioComp Profit customers can download a sample system from the "Build the models" section of Profit's support site.
GO BACK-- Carl Cook, BioComp Systems, Inc.
800 716-6770
E-mail cookcarl@biocompsystems.com
Internet https://www.biocompsystems.com
 NEUROSHELL TRADER
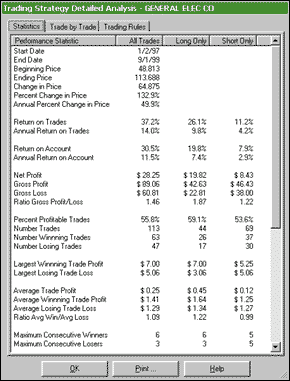
To implement in NeuroShell Trader the system that Stéphane Reverre describes in his article, "Trading The Opening Gap," you should first create a trading strategy. Enter the following entry/exit conditions in the appropriate locations of the Trading Strategy Wizard (be sure to select an order type of market close for the exit conditions):If you have NeuroShell Trader Professional, you can also choose whether the system parameters should be optimized. After backtesting the trading strategy, use the "detailed analysis" button to view the backtest and trade-by-trade statistics for this system (Figure 1).Generate a buy long market order if all of the following are true: A<=B(Mul2(100,Divide(Sub(Lead(Open,1),Close),Close)),-1)Generate a sell long mkt close order if all of the following are true: A=B(1,1)Generate a sell short market order if all of the following are true: A>=B(Mul2(100,Divide(Sub(Lead(Open,1),Close),Close)),1)Generate a cover short mkt close order if all of the following are true: A=B(1,1)

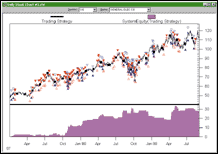
Once the trading strategy has been added to the chart, you can show the system equity by inserting the "System Equity: All Trades" indicator from the "Trading Strategy: System Information" indicator category (Figure 2). You can also apply the system to the entire 30 Dow Jones Industrial stocks by selecting "Add/Remove Chart Pages É" from the Edit menu.FIGURE 1: NUEROSHELL TRADER PROFESSIONAL. After backtesting the trading strategy, use the "detailed analysis" button to view the backtest and trade-by-trade statistics for the gap-trading system.

FIGURE 2: NEUROSHELL TRADER. Once the trading strategy has been added to the chart, you can show the system equity by inserting the "System Equity: All Trades" indicator from the "Trading Strategy: System Information" indicator category.
In practice, the trading signal is generated based on the opening price and the previous close (as described in the article). You can use NeuroShell Trader to calculate your open limit prices for the next day by inserting simple multiply indicators:
If you want to add the indicators manually, the following indicators represent items described in the article:Long Entry Open Limit Price: Mul2(0.99, Close)Short Entry Open Limit Price: Mul2(1.01, Close)
GO BACKLong Entry Condition: A<=B(Mul2(100,Divide(Sub(Lead(Open,1),Close),Close)),-1)Short Entry Condition: A>=B(Mul2(100,Divide(Sub(Lead(Open,1),Close),Close)),1)Current Profit: IfThenElseIfThen(<Long Entry Condition>,Sub(Close,Open),<Short Entry Condition>, Sub(Open,Close),0) where <Long Entry Condition> and <Short Entry Condition> are described above and can be selected from the Existing Data/Calculations if previously insertedCumulative Profit: CumSum(<Current Profit>) where <Current Profit> is described above and can be selected from the Existing Data/Calculations if previously inserted-- Marge Sherald, Ward Systems Group, Inc.
301 662-7950
E-mail wardsystems@msn.com
Internet https://www.neuroshell.com
 TECHNIFILTER PLUS
Below are two formulas for use with RTR Software's TechniFilter Plus. The first formula charts the cumulative profit of Stéphane Reverre's gap-trading system, and the second formula can be used to color the bars marking the trades. Since TechniFilter Plus lets you specify formulas for execution prices on trading systems, it can test this gap-trading strategy as a normal trading system. This trading strategy is also listed below.Formula for cumulative profit from gap tradingNAME: GapTrade SWITCHES: multiline PARAMETERS: 1,1 FORMULA:[1]: 100 * (O-CY1)/CY1 [2]: ([1]>&1) * (O-C) + ([1]<-&2) * (C-O) [3]: [2]F0 {nc}Formula for showing gap trade days in colorNAME: GapColor SWITCHES: multiline PARAMETERS: 1,1 FORMULA:[1]: 100 * (O-CY1)/CY1 [2]: ([1]>&1) - ([1]<-&2)Strategy for testing gap tradingFORMULAS----------------------------------[1] Date [2] GapColor(1,1)[1]: 100 * (O-CY1)/CY1 [2]: ([1]>&1) - ([1]<-&2)[3] Open O[4] Yest Close CY1RULES----------------------------------r1: EnterLong buy long 1 on [3] at signal: BuyDay [2] = -1r2: ExitLong stop long 1 on [4] at signal: NextDay [4]>0 { always true }r3: EnterShort open short 1 on [3] at signal: SellDay [2] = 1r4: ExitShort stop short 1 on [4] at signal: SellDay [4]>0 {always true}
These formulas and program updates can be downloaded from RTR's Website. Release 8.2 of TechniFilter Plus is now available.
GO BACK-- Clay Burch, RTR Software
919 510-0608
E-mail rtrsoft@aol.com
Internet https://www.rtrsoftware.com
 SMARTRADER
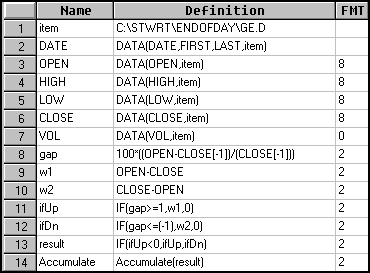
The gap system presented by Stéphane Reverre in "Trading the Opening Gap" is a very simple system to implement in SmarTrader (Figure 3).

FIGURE 3: SMARTRADER. Here is the SmarTrader specsheet for recreating Stéphane Reverre's gap-trading system.
Row 8 is a user formula to calculate the close-to-open gap. Row 9, w1, calculates OPEN-CLOSE for use in row 11. Row 10, w2, calculates CLOSE-OPEN for use in row 12. Row 11, ifUp, returns the value of w1 if gap is greater than or equal to 1. Row 12, ifDn, returns the value of w2 if the gap is less than or equal to -1. Row 13, result, returns the value of ifUp, if it is greater than zero, or else the value of ifDn is returned. Row 14, Accumulate, is the accumulated sum of all result values.
GO BACK-- Jim Ritter, Stratagem Software International
504 885-7353
E-mail Stratagem1@aol.com
Internet https://www.stratagem1.com
 WAVEWI$E MARKET SPREADSHEET
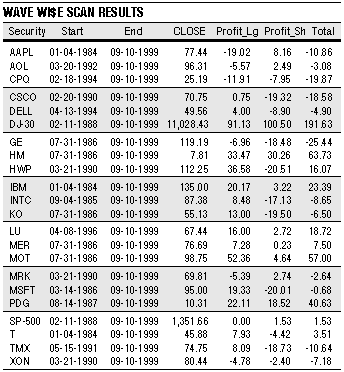
The following Wave Wi$e formulas show how to compute Stéphane Reverre's gap system in Wave Wi$e. We found that the results on the DJIA were indeed positive, while individual stocks yielded mixed results. We have included a scan of some selected stocks in the table in Figure 4.

GO BACKFIGURE 4: WAVE WI$E. Results for Stéphane Reverre's gap-trading system as implemented in Wave Wi$e are shown for selected stocks. System results on the DJIA were generally positive, while individual stocks yielded mixed results.A: DATE @TC2000(C:\TC2000\DATA,GE,GENERAL ELECTRIC CO,DB) B: HIGH C: LOW D: CLOSE E: OPEN F: VOL G: GapPcnt 100*(OPEN - CLOSE[-1]) / CLOSE[-1] H: UpPcnt 1 I: DnPcnt -1 J: Longs @SIGNAL2(CLOSE,BUY,GAPPCNT>UPPCNT, OPEN,1>0,CLOSE) K: L: Profit_Lg @PROFIT(J,K,LONG) M: Shorts @SIGNAL2(CLOSE,SELL,GAPPCNT<=DNPCNT, OPEN,1>0,CLOSE) N: O: Profit_Sh @PROFIT(M,N,SHORT) P: Total PROFIT_LG + PROFIT_SH Q:==========End Formulas-- Peter Di Girolamo, Jerome Technology
908 369-7503
E-mail jtiware@aol.com
Internet https://members.aol.com/jtiware
All rights reserved. © Copyright 1999, Technical Analysis, Inc.
Return to November 1999 Contents