BASIC TECHNIQUES
Applying Gann Angles To Computer Charts
by Brent Aston
Tried and true and far from being discarded, Gann angles are daily tools for some traders. Here's how to use two of W.D. Gann's central ideas in today's computerized environment.
Trader William D. Gann became famous in the early 20th century for his ability to forecast exact price targets in the stock and commodity markets. To arrive at his forecasts, W.D. Gann used a combination of methods, ranging from simple counts and angles to correlating natural events. Of course, many securities that exist now did not exist then, and volatility is very different from what it was in his time. However, the geometrical relationships that he applied to data appear to work equally well on modern data.

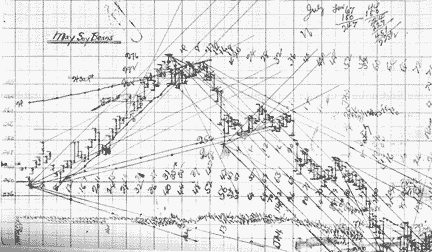
FIGURE 1: SOYBEANS. This hand-drawn chart of 1948 soybeans depicts W.D. Gann's basic techniques of drawing trendlines. (Reproduction courtesy of John Wiley & Sons.)
Of the work that he passed along, two of perhaps the best known but often misunderstood techniques are Gann angles and the squaring of data on charts. Gann squares and the squaring of a chart are totally different things and should not be confused. Squaring a chart is scaling data into uniform proportions, while Gann squares are squares containing a numerical sequence that W.D. Gann used to forecast future swing points. Applying Gann angles is a logical, mathematical method that requires only a few drawing tools to reproduce, or they may be applied to data via a personal computer.
Here are two specific methods of preparing and implementing Gann techniques, updating the hand method with the use of software.
GANN BY HAND
Before we examine Gann techniques with the use of software, let's look at the theories behind them.
Squaring: That Gann was fascinated by squares is evident in his work; he squared price and time, and he used a repeating count of four. To draw Gann angles, it is essential to set up your own chart the way that Gann did so that it is squared. Take a look at Figure 1.
A perfect square is equal in both width and height, with four equal sides and four right angles. Gann hand-plotted his data onto graph paper that consisted of small squares combined into larger squares containing 16 of the smaller squares. That square ratio is simply expressed as 4x4 (that is, 16 squares = 4x4).
The same ratio of width to height can be expressed as 1x1 or 1-to-1. When Gann plotted price on his charts, the data was in a 1-to-1 ratio, indicating one point to the square on the vertical axis, and one day (or one bar) to the square on the horizontal axis. This ratio -- one point to one day -- works well with some securities, but not all. Some securities require the use of fractions or decimals for the points.
Gann's method of squaring tends to confound many would-be practitioners. However, squaring charts by hand can be as simple as drawing a line and putting data on a 1-by-1 grid. A 1-by-1 grid works well on the grains, and that is what I use.
Brent Aston is a private trader. He may be reached at brente@infowest.com.
Excerpted from an article originally published in the December 1999 issue of Technical Analysis of STOCKS & COMMODITIES magazine. All rights reserved. © Copyright 1999, Technical Analysis, Inc.
Return to December 1999 Contents