Are Three-Bar Patterns Reliable For Stocks?
by Thomas Bulkowski
Futures traders often use a three-bar swing low as a reversal pattern, but is the three-bar pattern reliable for stocks? Find out here.
One example [to determine a change in direction] is a three-bar pattern, which is the same one that futures traders use. The stock establishes a low price as a swing point. Once the stock closes above the high of the low day, to me, that is a change of direction for an undetermined period.

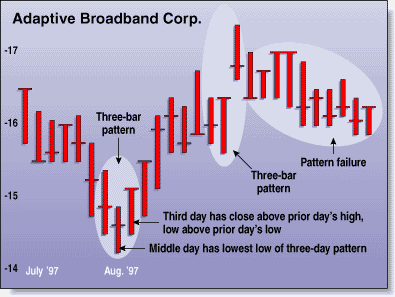
FIGURE 1: THREE-BAR PATTERN, SUCCESS AND FAILURE. The three-bar pattern suggests a swing change. The pattern on the right failed because prices didn't continue to move higher.
Using this description as a guide, I decided to formalize the shape and behavior of the pattern.
IDENTIFICATION RULES
What does the pattern look like? Here is my interpretation. The pattern conforms to the following rules:
- It uses daily prices, not intraday or weekly prices.
- The middle day of the three-day pattern has the lowest low of the three days, with no ties allowed.
- The last day must have a close above the prior day's high, with no ties allowed.
- Each day must have a nonzero trading range.
The first and third days must have a higher low than the middle day, with no ties allowed. This is suggested by the phrase swing point in the description of the pattern. Finally, each day must have a nonzero trading range. I added this rule to remove thinly traded stocks in which the high, low, and close are all at the same price. I did not want low-volume days or thinly traded stocks to influence the behavior of the typical pattern.
Figure 1 shows two three-bar patterns; the one on the left successfully acts as a reversal of the downward swing, while the right one fails when prices turn down after the pattern is completed. Most of the time, the price pattern continues upward; in fact, prices make a higher high the day after the formation ends 58% of the time, but this steadily decreases to 52% a week later. (About half the time, prices are still above the formation a week later.)
Thomas Bulkowski has a bachelor's degree in computer engineering and uses his software engineering skills to further his full-time investment activities. He is also the author of Encyclopedia Of Chart Patterns, from John Wiley & Sons.
Excerpted from an article originally published in the January 2000 issue of Technical Analysis of STOCKS & COMMODITIES magazine. All rights reserved. © Copyright 1999, Technical Analysis, Inc.
Return to January 2000 Contents