Are Two Channels Better Than One?
by Stéphane Reverre
This author tested two channels based on Bollinger Bands around a standard moving average and an application of the capital asset pricing model, and discovered that a combination of the two performs better than the two separately.

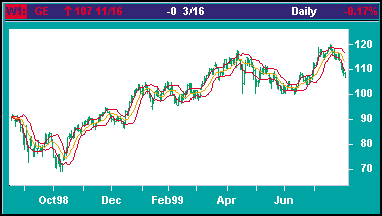
FIGURE 1: OHLC, GE. Here's the open-high-low-close chart of General Electric from August 18, 1998, to August 3, 1999, with a 10-day moving average and one-standard deviation Bollinger Bands.
I tested two channels based on Bollinger Bands around a technical indicator: a standard moving average and an application of the capital asset pricing model (CAPM). I discovered that a combination of the two performs qualitatively better than the two separately.
BOLLINGER BANDS
Bollinger Bands are a classic technical channel technique (see sidebar, "Calculating Bollinger Bands," to calculate your own). They are used to indicate how far a given stock deviates from a price reference such as a moving average or a close in terms of standard deviation (that is, volatility). The higher the volatility, the wider the band, and therefore the chances for the stock to exit from this band are similar in a period of high or low volatility. Because the bands have a width in relation to the volatility of the market, chances of stepping out are relatively constant regardless of actual volatility.
If the stock does exit a relatively wide range, that could be interpreted as a strong signal, but possibly in two opposing directions. The signal may be interpreted as a long or a short, depending on the effect that the crossover is meant to capture. There is the argument that the price is likely to correct and come back toward the middle of the band, and this view leads to positions against the move that led to the crossover. The opposing logic is also intuitively reasonable: the move is the indication of a new trend in formation, and the wise position would be in the same direction. Both interpretations have some foundation, but the second has a stronger support from backtesting results.
Bollinger Bands can be drawn over a number of different indicators. Traditionally, they have been associated with a short-term moving average, and that is the usage I will initially focus on. However, the same principle of variation within a band defined by current volatility applies to any indicator, and so I decided to use Bollinger Bands around an indicator built as an application of the CAPM.
Stéphane Reverre is working toward an MBA at Harvard Business School. Previously, he worked as an equity derivatives trader at a French leading financial institution in Tokyo and New York. He can be reached at sreverre@hotmail.com.
Excerpted from an article originally published in the January 2000 issue of Technical Analysis of STOCKS & COMMODITIES magazine. All rights reserved. © Copyright 1999, Technical Analysis, Inc.
Return to January 2000 Contents