TRADING TECHNIQUES
Market Phase And Chart Formation
by Chuck Dukas
Some market behaviors are more common during some market phases than others. Take a look.
Certain chart formations are often associated with certain market phases. Each chart has a personality of its own, no two being alike, just as you and I have our own personalities. I assess the movement of stocks in four phases (accumulation, markup, distribution, and markdown), and the crossing of the 50-period simple moving average (SMA) indicating that an intermediate bullish or bearish trend exists. I use two periods of closing price above or below the 50-period SMA to confirm the move.

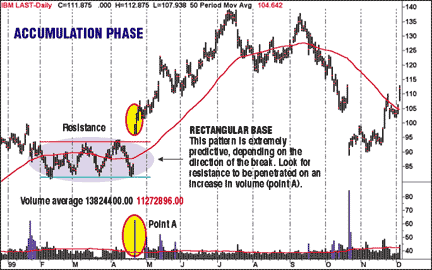
FIGURE 1: ACCUMULATION PHASE. In the accumulation phase, IBM formed a perfect rectangular base pattern. The optimal period for this setup usually spans six to 12 weeks (the longer the better), as it is like a rubber band that is stretched and ready to break. Supply and demand competes for dominance, and this sets the stage for explosive moves in the direction of the break. As noted, IBM takes out the resistance in very heavy volume at point A, confirming the move where we now enter into the markup phase.
During the markup and distribution phases, prices must be above the 50-period SMA, whereas during the distribution and markdown phases, prices must be below. I associate buying with the accumulation and markup phases and selling with the distribution and markdown phases.
ACCUMULATION PHASE
During the accumulation phase (Figures 1 and 8), supply and demand compete for dominance, usually following a major decline. Look for a bottom to be established. Here, the stage is set for an advance. As demand overcomes supply, price advances, generating higher lows. Price moves into a position to take out overhead resistance as the long positions take more and more stock off the market. This period usually spans six to 12 weeks.
Accumulation chart patterns encompass the following:
- Head and shoulders bottom (inverted head and shoulders)
- V bottom (spike reversal)
- Double bottom (W pattern)
- Triple bottom pattern
- Island reversal
- Rectangular base pattern (flat or neutral bottom)
- Saucer pattern (rounding bottom)
Chuck Dukas has been a trader, advisor, educator, and instructor in technical analysis for more than 20 years. Further examples on diamond analysis are available on his Website, https://www.trendadvisor.com/.
Excerpted from an article originally published in the February 2000 issue of Technical Analysis of STOCKS & COMMODITIES magazine. All rights reserved. © Copyright 2000, Technical Analysis, Inc.
Return to February 2000 Contents