| METASTOCK | |
| TRADESTATION / SUPERCHARTS | |
| NEUROSHELL TRADER | |
| TECHNIFILTER PLUS | |
| SMARTRADER | |
| WAVEWI$E MARKET SPREADSHEET |
or return to February 2000 Contents
You can copy these formulas and programs for easy use in your spreadsheet or analysis software. Simply "select" the desired text by highlighting as you would in any word processing program, then use your standard key command for copy or choose "copy" from the browser menu. The copied text can then be "pasted" into any open spreadsheet or other software by selecting an insertion point and executing a paste command. By toggling back and forth between an application window and the open Web page, data can be transferred with ease.
This month's tips include formulas and programs for:
METASTOCK TRADESTATION / SUPERCHARTS NEUROSHELL TRADER TECHNIFILTER PLUS SMARTRADER WAVEWI$E MARKET SPREADSHEET or return to February 2000 Contents
For the BogiePX enter:
x:=Input("length of 1st moving average",2,200,5);
y:=Input("length of 2nd moving average",2,200,10);

((y* Sum(C,x-1))-(x*Sum(C,y-1)))/ (x-y)
For the percent change, enter the following formula:
GO BACKx:=Input("length of 1st moving average",2,200,5); y:=Input("length of 2nd moving average",2,200,10);((((y* (Sum(C,x-1))-(x*Sum(C,y-1)))/(x-y))/Close)-1)*100-- Cheryl Elton, Equis Internationalhttps://www.equis.com
The indicator, called "seasonal SB -- short," is only active during the timeframe specified in the original seasonal soybean strategy. When entering the timeframe, the entry stop level will be displayed on the chart. Once a position is entered, the entry stop is no longer displayed and the indicator instead displays the profit stop and the protective stop levels. When the position is closed out, the indicator again begins to display the entry stop value until the end of the timeframe. By displaying the important strategy entry/exit levels, this indicator provides seasonal traders with a visual point of reference of their open position status.
Below is the EasyLanguage that is used to develop the "seasonal SB -- short" indicator in the PowerEditor. I have given some style and scaling recommendations immediately following the EasyLanguage.
The style and scaling for the above indicator should be set as displayed below:Name: Seasonal SB - Short Type: Indicator Inputs: EntryStop(16), ProtectStop(5), ProfitStop(11); Variables: EntryStp(0), ProtectStp(0), ProfitStp(0); Condition1 = Month(Date) = 5 AND DayOfMonth(Date) > 14; Condition2 = Month(Date) = 6; Condition3 = Month(Date) = 7; Condition4 = Condition1 OR Condition2 OR Condition3; Condition5 = I_MarketPosition = -1; EntryStp = Lowest(Low, EntryStop) - 6 Points; ProfitStp = Highest(High, ProfitStop) + 1 Point; If Condition5 <> Condition5[1] Then ProtectStp = Highest(High, ProtectStop) + 1 Point; If Condition4 AND Condition5 = False Then Begin Plot1(EntryStp, "EntryStop"); Plot2(EntryStp, "EntryStop"); End; If (Condition4 AND Condition5) OR Condition5 Then Begin Plot3(ProtectStp, "ProtectStop"); Plot4(ProfitStp, "ProfitStop"); End;
The design of this indicator is not exclusive to just this seasonal soybean strategy. The same idea can also be applied to other seasonal strategies as well by simply adjusting the dates and/or the entry and exit parameters.Style: Plot Name Type Color Weight Plot1 EntryStop Left Tic Red medium Plot2 EntryStop Right Tic Red medium Plot3 ProtectStop Right Tic Drk magenta medium Plot4 ProfitStop Right Tic Magenta medium Scaling: Same as Price Data
The EasyLanguage for the "seasonal SB - short" indicator and strategy described in the article are available for downloading from www.omegaresearch.com. The name of the file is "Seasonal.ELS."
GO BACK-- Gaston Sanchez, Omega Research Inc.800 422-8587, 305 270-1095
https://www.omegaresearch.com
Generate a sell-short stop order if one of the following are true:
And2(May Flag(Date),A>B(Day of Month(Date),14))
June Flag(Date)
July Flag(Date)

STOP PRICE: Sub(Min(Low,16),1.5)
Generate a short trailing stop at the following price levels:
Generate a cover-short Mkt Close order if both of the following are true:ValueEntryAct(Trading Strategy,Add2(Max(High,5),0.25),1) IfThenElse(A>B(EntryPrice(Trading Strategy,0),Max(High,11)),Add2(Max(High,11),0.25),20000)
If you have the NeuroShell Trader Professional, you can also choose whether the system parameters should be optimized. After backtesting the trading strategy, use the "Detailed analysis" button to view the backtest and trade-by-trade statistics for this system.August Flag(Date) A>B(Day of Month(Date),12)
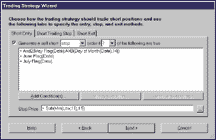
FIGURE 1: NEUROSHELL TRADER. This shows the short entry tab in NeuroShell Trader's Trading Strategy Wizard. |
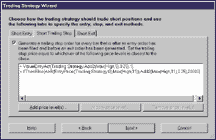
FIGURE 2: NEUROSHELL TRADER. Here is the short trailing stop tab in NeuroShell Trader's Trading Strategy Wizard. |
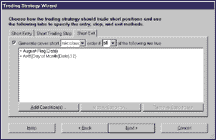 FIGURE 3: NEUROSHELL TRADER. This shows the short exit tab in NeuroShell Trader's Trading Strategy Wizard. |
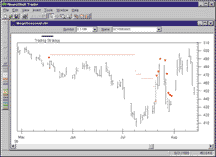
FIGURE 4: NEUROSHELL TRADER. Here's a NeuroShell Trader chart that graphically displays the trailing stop prices for the megaseasonal system. |
GO BACK--Marge Sherald, Ward Systems Group, Inc.301 662 7950, E-mail sales@wardsystems.com
https://www.neuroshell.com
These formulas and program updates can be downloaded from RTR's Website. Release 8.3 of TechniFilter Plus is now available.NAME: SoySeasons FORMULAS---------------------------------- [1] Date [2] month (CU15 \\ 10000) \ 100 [3] dayofmonth CU15 \\ 100 [4] EntryPrice(16) LN&1Y1 - 6 [5] ExitPrice(5) HM&1Y1 + 1 [6] ProfitPrice(11) HM&1Y1 + 1 [7] High H [8] Low L RULES---------------------------------- r1: SellShort open short 1 on [4] at signal: TargetHit [7]>=[4] & [8]<=[4] & ( ([2]=5 & [3]>14) ^ [2]=6 ^[2]=7 ) r2: ExitShort cover short 1 on [5] at signal: ProtectiveStop [8]<[5] & EntryIndex<CurrentIndex r3: ExitShort1 cover short 1 on [5] at signal: Stop EntryPrice>[5] r4: Exit2 cover short 1 on Close at signal: FinalExit [2] = 8 & [3]>12
GO BACK-- Clay Burch, RTR Software Inc.919 510-0608, E-mail: rtrsoft@aol.com
https://www.rtrsoftware.com
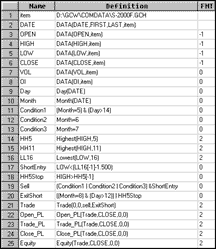
FIGURE 5: SMARTTRADER. This SmarTrader specsheet implements a seasonal trading system as described by John Momsen. It makes easy use of the date functions in SmarTrader.
Begin by adding the day and month functions. Then, using the formula builder, define Condition1, month is May, and the day is greater than 14. Note the use of parentheses in the definition of Condition1. Condition2 and Condition3 are month equal to June and July, respectively.
Use the highest and lowest functions to create HH5, HH11, and LL16. Again, use the formula builder to define the ShortEntry conditional statement and the highest five-day breakout stop.
Sell when Condition1 or Condition2 or Condition3 is true and ShortEntry is true. ExitShort when a five-day breakout occurs or the date is past August 12.
This SmarTrader specsheet is shown in Figure 5.
GO BACK-- Jim Ritter, Stratagem Software International504 885-7353, E-mail: Stratagem1@aol.com
https://www.stratagem1.com
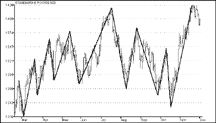
FIGURE 6: WAVE WI$E. You can use Wave Wi$e to help find swing pivot points for a given period. This chart shows sample results.
A: DATE @TC2000(C:\TC2000\DATA,SP-500,STANDARD & POORS 500,DB)
B: HIGH
C: LOW
D: CLOSE
E: OPEN
F: VOL
G: proc         PROCEDURE(SWING)
H: Pivots
I: PivotID
J: chart        @CHART(1)
K:

ÔSWING - DETERMINE HIGH AND LOW SWING PIVOTS
Ô============================================
#NAME PERIOD    X$5
#NAME ROWLO     X$1
#NAME ROWHI     X$2
#NAME PVLOW     X$3
#NAME PVHIGH    X$4
PERIOD=@INPUT(ENTER THE PERIOD OF PIVOT,7,1)
@IF @ROW() = 1 THEN     ÔINITIALIZE
        ROWLO=1         ÔROW OF LAST LOW
        ROWHI=1         ÔROW OF LAST HIGH
ENDIF
@CELLPUT(@COLUMN()+1,@ROW(),@BLANK())   ÔCLEAR PREVIOUS VALUES
@CELLPUT(@COLUMN()+2,@ROW(),0)  ÔCLEAR PREVIOUS VALUES
@IF LOW < @MIN(LOW[-1],PERIOD) THEN     ÔTEST FOR NEW LOW
        PVHIGH=@MAX(HIGH,@ROW()-ROWLO)  ÔLOCK IN THE HIGH
        ROWHI=@ROWOF(@MAX(HIGH,@ROW()-ROWLO))
        @CELLPUT(@COLUMN()+1,ROWHI,PVHIGH)
        @CELLPUT(@COLUMN()+2,ROWHI,1)   ÔSAVE HIGH ID
        @RETURN(1)      ÔSHOW FOUND HIGH
ENDIF
@IF HIGH > @MAX(HIGH[-1],PERIOD) THEN   ÔTEST FOR NEW HIGH
        PVLOW=@MIN(LOW,@ROW()-ROWHI)    ÔLOCK IN THE LOW
        ROWLO=@ROWOF(@MIN(LOW,@ROW()-ROWHI))
        @CELLPUT(@COLUMN()+1,ROWLO,PVLOW)
        @CELLPUT(@COLUMN()+2,ROWLO,-1)  ÔSAVE LOW ID
        @RETURN(-1)     ÔSHOW FOUND LOW
ENDIF
@RETURN(0)      ÔSHOW FOUND NEITHER

==========End Formulas
GO BACK-- Peter Di Girolamo, Jerome Technology908-369-7503, E-mail: jtiware@aol.com
https://members.aol.com/jtiware