TRADING TECHNIQUES
Adaptive Trends And Oscillators
The Twain Meets Here
by John F. EhlersCan the market be modeled as a combination of a trend mode and a cycle mode? This longtime S&C contributor says yes. Here, he explores two indicators to trade each mode; one is the new, adaptive version of an indicator originally introduced in 1996, and it does well in trading ranges but steps aside in trends. With this new version, you can address both modes of the market without interfering with the other -- and that's something that traders have been waiting for.

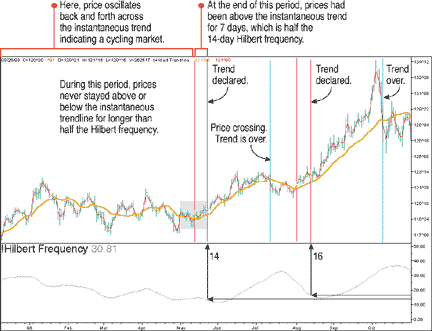
FIGURE 1: TREND TRADING. By using the instantaneous trendline (seen in yellow), it's straightforward to take a position if prices stay on one side of the line more than half the number of days in the instantaneous (Hilbert) frequency. Red bars show periods when that occurred, while blue bars are exit points.
But wait! There's more. By removing the cycle from the trendline and only looking at the cycle in the sinewave indicator, you can address both modes of the market without interfering with the other mode. You can do this with the new and improved version of the sinewave indicator, one that is adaptive and works to identify turning points in the cycle. This way, you can indeed combine trends and cycles.
First, let's look at trends and modes individually, and find out what they're all about. Then we'll examine how they can be combined.
TREND MODE TRADING:
THE INSTANANEOUS TRENDLINE
Traditionally, moving averages have been used to study trend mode because the moving average forms a visual trend of the data. By using a technical market model of a trend plus a dominant cycle, I created something I call an instantaneous trendline by removing the dominant cycle from the price information. I can do this because I measured the period of the dominant cycle using the technique I described in the March 2000 issue (see sidebar, "Using the Hilbert transform").
If you remove the dominant cycle component, what's left -- the average across the cycle -- is the residual. This filtered residual is the instantaneous trendline. This adaptive trendline looks like a simple moving average, but in this case, the period of the dominant cycle changes as we move across the chart, so the period of the simple average must change accordingly. The code given accomplishes this by examining each day of the last 40 days of data.
By itself, the instantaneous trendline doesn't beat lag; the trendline lag will always be half the period of the measured dominant cycle. The EasyLanguage code to compute the instantaneous trendline can be found in the sidebar, "Instantaneous trendline."