CLASSIC TECHNIQUES
Peaks And Troughs
by Martin J. Pring
The oldest ways of chart analysis had to work in the days before computers (B.C.). There's no reason they shouldn't work now. Here's a look at peaks and troughs, a classic form of chart analysis that worked B.C. and work now.
I have always thought that, in general, the simplest techniques work the best. High up in this category, and perhaps the most underrated, is the concept of peak and trough analysis, a technique first brought to our attention as a tenet of Dow theory. While the theory itself has lost much of its luster in recent years, the peak and trough part of it has not. It is arguably the most important building block of technical analysis.

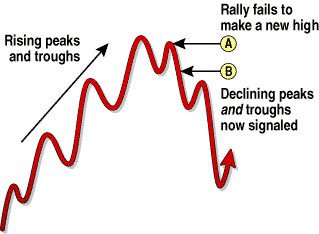
FIGURE 1: USE PEAKS AND TROUGHS TO DETERMINE TREND. As peaks and troughs rise, trend is up. As they fall together, trend is down.
When you look at almost any chart, it's fairly evident that prices do not go up and down in straight lines, but move in zigzag patterns instead. During a bull trend, a rally is interrupted by a correction in which part of the advance is retraced. This is then followed by another rally, after which a subsequent correction follows, and so on.
These are the peaks and troughs. As long as a trend experiences a series of rising peaks and rising troughs, it is considered to be intact. However, when the series of rising peaks and troughs is replaced by a series of declining peaks and troughs, the prevailing trend has reversed.
Figure 1 shows a series of rising peaks and troughs. When a subsequent rally fails to make a new high for the move (A), this alerts us the trend may have changed. It is not until the price slips below the previous bottom (B), however, that the price action reveals a declining peak and trough. The trend, according to this technique, is now deemed to be bearish.
In a bear trend, prices continue their downward zigzag (Figure 2) until the latest trough fails to make a new low for the move (C). The subsequent rally takes the price above the previous high (D), and the series of declining peaks and troughs gives way to a series of rising ones. The actual signal takes place at E, when it is evident that the price has made a new high. At that point, we do not know where the next peak will occur, but we do know it is likely it will be higher than the previous one.
As you can see from the price action at point F, there is nothing to stop the price from falling below the trend reversal signal (E), but pricing will still be consistent with a rising trend.
Martin J. Pring founded the International Institute for Economic Research in 1981. He is the author of several books, including the classic Technical Analysis Explained, and Introduction To Technical Analysis, the first technical analysis multimedia CD-ROM. He pioneered the introduction of videos as an education tool for technical analysis in 1987, and was the first to introduce educational interactive CDs in this field. His Website is https://www.Pring.com, and he may be reached at info@Pring.com.
Excerpted from an article originally published in the May 2000 issue of Technical Analysis of STOCKS & COMMODITIES magazine. All rights reserved. © Copyright 2000, Technical Analysis, Inc.
Return to May 2000 Contents