Using Paper And Pencil, For Cotton
Long-Term Commodity Trades
by Andre Zupans
Large commodity firms, commercial producers, and mature speculators know that capturing huge moves in commodity markets may take years. Here's that technique, demonstrated nicely.
If you believe the news media, short-term traders and daytraders are everywhere. Certainly, their numbers have exploded due to the unprecedented bull market in stocks. Are they consistently successful? Doubtful. Transaction costs, overtrading, and small profits and large losses plague these short-term traders.

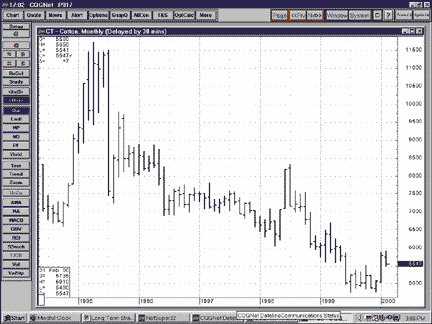
FIGURE 1: COTTON. Since 1995, cotton has declined nearly 50% from its highs. As of late December 1999, it appeared to be basing. Could this have been the beginning of a move upward?
Long-term trading eliminates most of these problems, and a good strategy is required in order to be a successful long-term trader. Discipline and patience is also a prerequisite for making money in any time frame, but especially for long-term trading.
Here is a long-term strategy for the commodity trader. No computer is necessary. All you need are:
1 Monthly and weekly commodity bar chartsConstruct your own parameters, or use the loss of 30% of option premium and commit 75% of total trading capital on each position.
2 Weekly point and figure charts
3 The strategy I'll give you, and
4 Stops and money management.
Every five years or so, as the world economy fluctuates, great speculative opportunities permit small-stake speculators to generate very large returns. Most traders do not recognize these opportunities, and even fewer have the courage to buy at a major low or sell at a major high. This is human nature and is the primary reason it's so hard to get rich trading the markets. As of this writing, in December 1999, cotton offers that great opportunity for large profits.
TRADING COTTON
Cotton has been in a severe decline for nearly five years. Is cotton making a major low? It's likely. In that case, we should be expecting a countertrend rally retracing about 50% of the entire decline. Shortage turns to glut; glut turns to shortage. At $0.50 a pound, cotton producers can't make much profit -- so they plant less cotton. This sows the seeds for a shortage, propelling cotton prices higher. Supply and demand determine price, and the bar or point-and-figure charts (Figures 1 and 2) map the result.
Andre Zupans is president of Breakoutintelligence.com. He can be reached at 719 687-7347, or via E-mail at Lzupans@msn.com.
Excerpted from an article originally published in the May 2000 issue of Technical Analysis of STOCKS & COMMODITIES magazine. All rights reserved. © Copyright 2000, Technical Analysis, Inc.
Return to May 2000 Contents