![]()
![]()
TECHNIMENTALS.COM
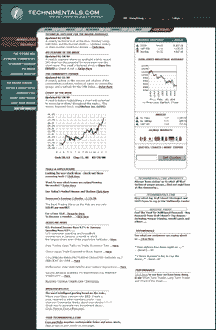
The professional look of the Technimentals.com home page is enough to invite you to explore the site. As the name suggests, the information contained in this site is a combination of both technical and fundamental analysis. A quick glance at the home page will provide you with a synopsis of the site's contents. You have access to information on the major averages, IPOs, commodities, biggest movers, global markets, option statistics, and bond markets. In addition, you can view economic and earnings calendars, screen stocks, get an idea of which sectors you should be monitoring, the morning report, and short/long-term trading recommendations.

Technimentals.com
The home page contains a scrolling ticker displaying the most actives, % gainers/losers, and the major global indices. A left-click on any symbol will bring up a detailed window displaying the last trade, change, volume, open trade, and day's range.
There is a section on the home page titled Market Snapshot that displays the performance of the DJIA, Standard & Poor's 500 and Nasdaq. An intraday chart of the DJIA displaying the previous close can also be viewed. This is followed by the performance of the Dow Jones transports, DJ utilities, and the S&P 100. If you want to know what is happening in the major global exchanges, you can find it on this site. You can get information on Canadian, Japanese, British, French, German, and Italian markets. A click on the particular country's flag will bring up a page that displays the major benchmarks specific to that market, a brief market summary, chart, technical summary, and an overall rating. Unfortunately, this information is not updated on a daily basis.
Links to the various features available on this site are arranged on the left-hand side. The Closing Bell is a wrapup of market activity updated after the close. From here, you can get a list of the most actives, new highs, new lows, option statistics, interest rates, and yields.
The Economic Commentary feature contains information on interest rates, stock market indices, gold prices, and the economy. The Economic Calendar displays the numbers such as Gross Domestic Product, durable-goods orders, and jobless claims that will be announced during the week or month. Ipo displays the top-performing issues, current Ipo calendar, and recent filings. The Earnings Monitor feature displays a calendar where you can click on any date during the current month to see which companies will be reporting on that day. You can also get a list of the 50 positive and negative surprises during the last 30 days. You can receive reports as well as register to receive streaming audio/video reports and get daily or hourly E-mail alerts, also from the First Call homepage. These services are available through ON 24.
These features are free of charge. For $19.95 a month or $199.99 per year, you can get access to long- and short-term trading recommendations, sector and group focus, real-time trading chat room, chart of the week, and the privilege of sending one E-mail a day to the Technimentals.com analysts asking about a specific stock.
There are also stand-alone services, such as Technimental.com University and consulting services. You can get an education at the university on using charts, support and resistance levels, relative strength index (RSI), and moving average convergence/divergence (MACD). It also includes a series of seminars that are designed to help traders make consistent profits by utilizing the technimental strategies, which were developed by chairman and CEO Kevin Lane.
The main section of the Website contains various sections that deserve mention. The Technical Outlook for the Major Averages section contains charts of the DJIA, Nasdaq, S&P 500, and Russell 2000. These charts incorporate technical indicators and also include a summary of the technical outlook. The IPO Feature of the Week features a stock that recently went public and is likely to make a move. The Chart of the Week gives a company summary, a chart with technical indicators, and a technical summary. The Commodity Corner gives a list of the movers in the commodity markets, along with a chart that displays their volatility. There are also charts and technical outlooks of the CRB index and spotlighted commodities, which get weekly updates.
The information available on this Website is comprehensive. Visitors can get an outlook on major market activities as well as individual stocks or commodities. Technical analysis summaries are explained clearly, making it easy for novice traders to understand the concepts involved. Seasoned technical analysts will also find this site interesting and informative.
STOCKPOINT.COM
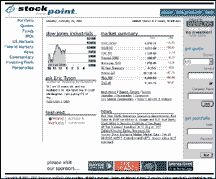
If you want to set up your portfolio, receive quotes, fund information, information on upcoming initial public offerings (IPOs), and keep abreast of US and global markets, the StockPoint.com Website will meet your needs. You can personalize these services by creating a custom portfolio, receiving real-time quotes, E-mail alerts, and customize your stock ticker -- and all this just involves a free registration.

Stockpoint.com
The Website contents are arranged on the left-hand side. A click on Portfolio will require you to enter your login and password. This gives you access to your customizable portfolio.
If you go to Quotes, you can enter a symbol or company name, which brings up a quote table displaying details such as open, high, low, close, volume, 52-day high, and so forth. From here, you get access to company information, charts, analyst ratings, and fundamentals.
The quick chart and interactive charts are interesting features on this site. In Quick Charts, you have the flexibility to compare the chart with other stocks, compare it to an index, and have a choice of seven indicators to insert. The interactive chart is similar to the quick chart but has some additional features. These include being able to zoom in on a particular period, viewing indicators, and the other features such as comparison stocks and indices after they are selected instead of refreshing the screen. The site also includes stock and fund screeners. You can get a list of the 25 top stocks and funds and screen based mainly on fundamental criteria.
The IPO section is still in the beta stage, but as of this writing, you can get a list of current IPO pricings and filings. A click on US Markets brings up a DJIA intraday chart, a market summary listing some of the broader indices, and a list of major currencies and news. From here, you can get links to other world markets. This brings up a page similar to that found in the US Markets section but displays indices and news relevant to the selected country. In addition, you get updated market commentaries, strong stocks, a list of market movers, upgrades/downgrades, splits, earnings, and economic calendars. The World Markets section displays intraday charts of the broader indices of various markets.
If you wish to ask a financial-related question, click Commentary and submit your question. You can also view the Q&A archive and see if your question has been answered before.
This is a site where you can get an overall picture of both the US and global markets. It is ideal for traders who select stocks based on fundamental data and enter or exit their trades using technical analysis. Once you get a list of screened stocks, you can view their charts with a single click and insert any of the built-in indicators to do your technical analysis.
INO.COM
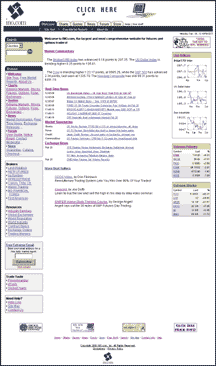
If you're a futures and options trader and looking for a one-stop Website, the ino.com site is worth a visit. The home page contains intraday charts of indices such as the CRB/Index, US Dollar Index, bonds, and the Dow Jones industrials. You also receive updated news, summaries of various markets such as stocks, foreign exchange, credit, and commodities. Commentaries of the CRB/Index, US Dollar Index and the DJIA, news, market summaries, and a list of extreme futures and stocks are also available.

Ino.com
Since this site contains a considerable amount of information, it would be wise to click on "Site Tour" to get an overall picture of its contents. Here, the contents are divided into logical subheadings, enabling you to get an idea of what the site has to offer. The various sections are:
- Free charts & quotes
- On-line store
- Trade tools
- Reports
The charts section contains charts of various indices, futures contracts (divided by exchanges), Internet stocks, technology stocks, Dow 30 stocks, foreign exchange markets, extreme futures, and stocks. You have the option of receiving market reports by E-mail. The Quotes section contains the same information as the chart section. The News section contains market summaries of stocks, forex, credit and commodities markets, real-time and exchange news. Visitors have access to the Forum, where you can view and post messages. There is also an online bookstore offering books relevant to trading.
In addition to these free features, there are subscription-based services. These include the Power Analyzer, iiTools, and Global Charts.
The Power Analyzer is a complete options analysis tool available for $499. You can enter the symbol of any stock, futures contract, or index and instruct the program to retrieve data. This will bring up the expiration date, strike price, bid/ask, fair value, implied volatility, the greeks, and open interest. You can scroll down the list of all strike prices to determine which one you want to buy/sell. Once you set up your strategy, you can instruct the program to compute possible results. A table displaying the profitability and probability of achieving that profit at various prices of the underlying can be seen.
You also have the option of screening stocks by selecting built-in criteria. For example, if you select "Exp. P/L for Call Debit," a list of stocks that meet the criteria will be displayed. You can then do an analysis on any of the listed stocks.
You can also use the Auto Analyzer, which will bring up various options strategies such as straddles, strangles, and spreads. You can select any of these and it will display the expected profit/loss and the probability of achieving it.
Other features include Technical Analysis Tools and the Profit/Loss graph. The Technical Analysis Tools feature lets you select and plot on a chart several indicators such as volatility ratio, volatility history, moving averages, stochastics oscillator, and power trend analysis. You have the flexibility to input parameters for the indicator. Once the chart is displayed, you can zoom in/out, use the scroll bar located across the bottom, and get details of price activity on any given day. The details such as the open, high, low, and close will be displayed on the right-hand side. An example of the chart is displayed in Figure 1.
FIGURE 1: INO.COM TECHNICAL ANALYSIS TOOLS. A price chart of the selected security along with the selected indicator is displayed. You have the flexibility to change the input parameters.
A click on the profit/loss graph button will display the profit/loss graph for the specific security. You can enter your desired profit and it will compute the probability of achieving that desired profit and mark it on your chart (Figure 2). Also, here you have a scroll bar similar to that in the Technical Analysis Tools feature.
FIGURE 2: INO.COM PROFIT/LOSS GRAPH. The profit/loss graph of Verisign, Inc. [VRSN] for the 250 calls with a desired profit of 50 can be seen here.
IITools is an analytical tool for trading futures, stocks, and indices. The trading signals are combined to generate recommendations for various issues. The three systems are Turtle system, My Own Money (MOM) and Periods of Profit (POP). You can use any of these and view the results to determine your entry and exit points for the next trading day. Back-tested results and current positions will be displayed so you can see how the system performed in the past. You can take advantage of the free trial offer before committing to subscribe to their service, which costs $299. Both novice and experienced traders will benefit from this.You select one of the three systems and indicate whether you want buy or sell signals. A list of stocks, futures, or indices that meet the selected criteria will be displayed. You can click on any symbol shown and have the results or graphs displayed. The graphic display shows the equity graph showing the base and cumulative profits.
For $20 to $25 per month, you can get access to Global Charts. These charts cover 10 major markets and include technical indicators and line studies. All paid services come with a free trial, giving you the opportunity to examine the system before making the decision to buy it.
This is a Website that futures and options traders will find beneficial. It covers everything from quotes, charts, and news to detailed options analysis plus trading signals. To refer to ino.com as a "one-stop site" would do it justice.
Originally published in the May 2000 issue of Technical Analysis of STOCKS & COMMODITIES magazine. All rights reserved. © Copyright 2000, Technical Analysis, Inc.