NEW TECHNIQUES
Warehousing Data For Better Trading Systems
by Joseph M. Fisher, M.D., Ph.D.
Technically based trading systems are generally back-tested with tens to hundreds of entry signals. Here's a method to develop robust trading systems using more than 2.5 million signals by applying data warehousing technology.
In today's markets, the development and implementation of robust trading strategies is no simple task. One way to do this is to develop a set of trading rules and then backtest them on a small number of stocks (less than 50), in the expectation that the system will perform similarly with the universe of securities that the system has yet to see. Some software products have been designed specifically for this approach -- to test indicators, buy signals, and trading systems on one stock at a time and then tabulating the results for review. Unfortunately, many systems that look promising when tested on small numbers of stocks fail in real-world situations due to curve-fitting, insufficient sample sizes, the peculiarities of the time series under study, or a changing market environment. I'll look at a way to test entry signals and trading systems on 500 stocks simultaneously using a large relational database known as a data warehouse.

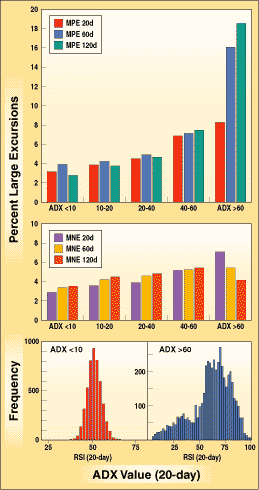
FIGURE 1: TESTING THE ADX INDICATOR. A random sample of 100,000 entry signals is divided into five bins dependent on the value of the 20-day ADX indicator. The percentage of stocks in each bin that exhibited large positive or negative price excursions over the next 20, 60, and 120 days is plotted (top two bar charts). Higher ADX values predict a high percentage of large positive price excursions. The values of the 20-day RSI were measured for each entry (bottom two histograms): stocks with ADX<10 have RSI values near 50, while stocks with ADX>60 tend to show strong relative strength (RSI>50).
CREATING A WAREHOUSE
To test trading systems on hundreds or thousands of stocks simultaneously, I needed a data structure and analysis system significantly different from those that test on one stock at a time.
Over the past five years, there have been tremendous gains made in the ability to store massive amounts of data and to analyze the data for meaningful relationships using data mining or business intelligence software such as Powerplay from Cognos Inc. or DB2 Intelligent Miner from IBM. Most Fortune 500 companies have multiterabyte data warehouses and use some form of data mining in their marketing and business strategy decision-making. If I could create a specialized data warehouse of stock chart-based information, I reasoned, I could apply these tools to look for relationships between predictors such as technical indicators, fundamentals, and market conditions and outcomes such as returns and directional price excusions. To do this, I created a large relational data warehouse consisting of chart-based information (see sidebar, "Constructing a data warehouse").
The process began with the two-year chart of an individual stock. I chose the midway point in the chart as the analysis reference date (ARD), and all measurements were calculated relating to this point. Predictor variables and measurements (that is, those that may be useful in determining desired future outcomes) pertain to the ARD or periods prior to it; calculated outcome measurements refer to the stock's price changes after the ARD. At the same time, I prepared a chart of the Standard & Poor's 500 as a surrogate for the market, along with predictor and outcome variables pertaining to it.
Each individual stock/ARD combination resulted in one row in the data warehouse and was assigned a record number; this number represents a unique entry signal for a particular security. The warehouse contains many different data types for each entry, including general information (20 variables), technical data (186 variables), binary conditions (130), company fundamentals (42 variables), market environment (93 S&P 500–related variables), and outcome measurements (135).
Joseph M. Fisher is president and Ceo of Equitymine, Inc., a company developing Internet-based decision support tools for traders using data warehousing and mining technologies. He can be reached at Equitymine, Inc., 177 Dale Ave., San Carlos, CA 94070, 650 654-2055, or via E-mail at jmfisher@equitymine. com.
Excerpted from an article originally published in the June 2000 issue of Technical Analysis of STOCKS & COMMODITIES magazine. All rights reserved. © Copyright 2000, Technical Analysis, Inc.
Return to June 2000 Contents