BASIC TECHNIQUES
Using The Simple Moving Average
by Martin J. Pring
Moving averages are the mainstay of technical analysis, and at the heart of moving averages is the perennially useful simple moving average. It can help smooth out random fluctuations in the financial markets, offering a better look at the trend.
Technical analysts agree that prices move in trends, and that once under way, trends tend to continue. However, a quick glance at any freely traded financial market suggests that while trends do exist, there is a substantial amount of random noise that makes identifying trend reversals a challenging task. Moving averages (MA) are a well-known, long-established technique that helps smooth out these fluctuations.

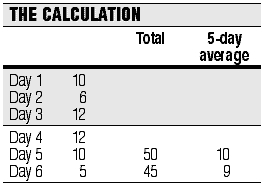
FIGURE 1: MOVING AVERAGE COMPUTATION. Simple moving averages are a widespread tool.
I could write a book on the different types of moving averages that have been developed over the years, but in my own work, I keep coming back to the simple moving average. Here's why.
CALCULATION
An average is constructed by calculating an average price over a specified period -- say, five days. In Figure 1, the total of 50 for the five days divided by 5 gives us an average of 10; then, day 1 is removed and the closing price of 5 on day 6 is added in, and day 1's close of 10 is subtracted. This gives us a total of 45 -- or a moving average of 9. This process then continues.
Since the average is an average of the data used in the calculation, it should really be plotted as a centered average -- that is, in the center of the data for which the average is calculated. Figure 2 features a centered 45-day moving average for Ibm (the solid smoothed line). You can see the average change direction almost simultaneously with the trend, offering some accurate signals. The problem is that it is not apparent the average has reversed direction until some time after the fact (until the other half of the time span used in the calculation has elapsed). By that time, this new trend may already be close to termination.
You can appreciate this from the fact that the last plot for the average occurred in mid-November -- 22 to 23 days before the last day of the chart. In the intervening period, a substantial part of the new trend has already taken place. As a result of this disadvantage, technicians have learned to plot the MA on a noncentered basis using the price crossover of the average as trend reversal signals instead. This is represented as the dashed line in Figure 2. A buy signal develops when the price moves above the average, and a sell signal develops when it crosses below.
Martin J. Pring founded the International Institute for Economic Research in 1981. He is the author of several books, including the classic Technical Analysis Explained, and Introduction To Technical Analysis, the first technical analysis multimedia CD-ROM. He pioneered the introduction of videos as an educational tool for technical analysis in 1987, and was the first to introduce educational interactive CDs in this field. His Website is https://www.Pring.com, and he may be reached at info@Pring.com.
Excerpted from an article originally published in the June 2000 issue of Technical Analysis of STOCKS & COMMODITIES magazine. All rights reserved. © Copyright 2000, Technical Analysis, Inc.
Return to June 2000 Contents