| OMEGA RESEARCH EASYLANGUAGE | |
| BIOCOMP PROFIT2000 | |
| AIQ TRADINGEXPERT | |
| NEUROSHELL TRADER | |
| BYTE INTO THE MARKET | |
| INVESTOR/RT | |
| SMARTRADER | |
| WAVEWI$E MARKET SPREADSHEET |
or return to June 2000 Contents
You can copy these formulas and programs for easy use in your spreadsheet or analysis software. Simply "select" the desired text by highlighting as you would in any word processing program, then use your standard key command for copy or choose "copy" from the browser menu. The copied text can then be "pasted" into any open spreadsheet or other software by selecting an insertion point and executing a paste command. By toggling back and forth between an application window and the open Web page, data can be transferred with ease.
This month's tips include formulas and programs for:
OMEGA RESEARCH EASYLANGUAGE BIOCOMP PROFIT2000 AIQ TRADINGEXPERT NEUROSHELL TRADER BYTE INTO THE MARKET INVESTOR/RT SMARTRADER WAVEWI$E MARKET SPREADSHEET or return to June 2000 Contents
In Traders' Tips this month, we take a look at the trend-following system and its accompanying indicators as presented in "How To Get In With The Trend And Out At The End" by Bryan Strain in this issue.
OMEGA RESEARCH EASYLANGUAGE
A set of three indicators are used, and each contributes a criterion for entering the market. For the record, when I implemented this trend-following strategy in EasyLanguage, not all of my entries and exits coincided with those presented in the article.
Here is the EasyLanguage code for the three indicators that were described in the article, as well as the EasyLanguage code for the signal that is used to create the trading strategy. The indicators and the trading strategy are fairly straightforward. The properties for each indicator are presented after the EasyLanguage. The first indicator presented is the tether line indicator.
GO BACKThe next indicator is the volume oscillator indicator.Name: TFS: Tether Line Type: Indicator Input: Length(50); Variables: HighVal(0), LowVal(0), Tether(0); HighVal = Highest(High, Length); LowVal = Lowest(Low, Length); Tether = (HighVal + LowVal) / 2; Plot1(Tether, "Tether"); Chart style: PlotName Style Weight Tether Line thinnest Scaling: Same as symbolThe third indicator is the MBO indicator.Name: TFS: Vol Osc Avg Type: Indicator Input: AvgLength(7); Variables: VolAccum(0), VolOsc(0); VolAccum = 0; For value1 = 0 To AvgLength -1 Begin If Close[value1] > Open[value1] Then VolAccum = VolAccum + Volume[value1]; If Close[value1] < Open[value1] Then VolAccum = VolAccum - Volume[value1]; End; VolOsc = VolAccum / AvgLength; Plot1(VolOsc, "Vol Osc"); Plot2(0, "ZeroLine"); Chart Style PlotName Style Weight Vol Osc Histogram thinnest ZeroLine Line thinnest Scaling: ScreenFinally, everything is brought together in the TFS signal. Below is the EasyLanguage for the TFS signal. The signal is referenced in StrategyBuilder to create the TFS strategy.Name: TFS: MBO Indicator Type: Indicator Inputs: FastAvg(25), SlowAvg(200); Variable: MBO(0); MBO = Average(Close, FastAvg) - Average(Close, SlowAvg); Plot1(MBO, "MBO"); Plot2(0, "ZeroLine"); Chart style: PlotName Style Weight MBO Histogram thinnest ZeroLine Line thinnest Scaling: ScreenThis EasyLanguage code for the TFS indicators, signal, and strategy are also available from Omega Research's Website. Two files will be posted: TFS.ELS and TFS.ELA. The TFS.ELS file is for TradeStation and ProSuite 2000i. TFS.Ela is for all other software versions (including SuperCharts). The QuickEditor cannot edit the contents of either of the TFS files.Name: TFS Signal Type: Signal Inputs: TetherLen(50), OscAvgLength(7), MBOFastAvg(25), MBOSlowAvg(200); Variables: MBO(0), Tether(0), VolAccum(0), VolOsc(0); VolAccum = 0; For value1 = 0 To OscAvgLength -1 Begin If Close[value1] > Open[value1] Then VolAccum = VolAccum + Volume[value1]; If Close[value1] < Open[value1] Then VolAccum = VolAccum - Volume[value1]; End; Tether = (Highest(High, TetherLen) + Lowest(Low, TetherLen)) / 2; MBO = Average(Close, MBOFastAvg) - Average(Close, MBOSlowAvg); VolOsc = VolAccum / OscAvgLength; {Entry Conditions} Condition1 = Close Crosses Above Tether; Condition2 = VolOsc > 0; Condition3 = MBO > MBO[1]; If Condition1 AND Condition2 AND Condition3 Then Buy Next Bar at Market; {Trailing Exit} If Close Crosses Below Tether Then ExitLong Next Bar at Market;-- Gaston Sanchez, EasyLanguage ExpertOmega Research Inc., 800 422-8587, 305 270-1095
https://www.omegaresearch.com
GO BACKFor Traders' Tips this month, we are presented with an elegantly simple trading system in Bryan Strain's "How To Get In With The Trend And Out At The End" in this issue. This system is easily implemented in BioComp Profit 2000.
Just as with a linear indicator-based trading system, a nonlinear neural network system attempts to generalize on relationships discovered in the training and testing datasets, and then profitably apply those relationships in simulated trading, more commonly known as the validation dataset, before actual trading takes place. Typically, we'll find that simple trading ideas prove to yield the most robust results in the all-important simulated trading portion of the data.
First, we'll explain how to set up the trend-following system (TFS) described in the article, and then we'll show how to possibly improve upon it with additional nonlinear methods of analysis.
Use daily data to select a stock that exhibits a propensity to trend. Once the data is loaded in a date/open/high/low/close/volume format, we will first copy the close field twice from the "transformations" dialog box in order to apply both a 200- and a 25-period simple moving average. Then we will take the difference between the two using the Diff function. This process offers us the MBO indicator.
For the second of the three indicators, we will again copy the close twice in order to apply both a 50-period "moving min" and a "moving max" transformation. Sum these two values, and then multiply by 0.5 with the SUM and the MULTIPLY functions, respectively. This will give us the tether line indicator.
The final indicator is the volume oscillator. To force the oscillator to result in a positive value when the close is higher than the open, and a negative value when the close is lower than the open, we will need to multiply volume by a "1" or "-1" based on the change in the closing price. Let's begin by copying the close and the open once, and then, using the Diff function, we'll subtract the close from the open. This will yield the one-day change in the close relative to today's open. Now let's take the binary transformation of this one-day change and accept the default value of zero to force the change in the close to be either a "1" or a "-1." Next, we'll use the Product function to multiply this binary transformation by volume. The last step is to simply apply the seven-day simple moving average (SMA) to this result. What we now have yields the exact same values as those given by the volume oscillator described in the article.
After deleting the extraneous leftovers in addition to the volume field, your transformation window should now appear as such:
When modeling with neural networks, we will need to develop a target variable to regress on. A good choice would be to let Profit 2000 do this for you, based on the frequency you wish to trade. Simply highlight the close field and click "Predict this." Then click on "Profitability" in the "Transformations" window and define how often you wish to trade. Note that the Tfs described in the article will trade with a lower frequency than, say for example, a typical swing trading system, and you should probably choose a value higher than five or 10 for your target. Now click "Optimize," and then "Apply."Date Open High Low Close Diff(SMA(Close|200)|SMA(Close|25)) SMA(Prod(Binary+-(Diff(Close|Open)|0)|Volume)|7) MULT(Sum(Moving Min(Close|50)|Moving Max(Close|50))|0.5)That's all there is to it. Now you are ready to send your data to NGO (the neural modeling engine) by simply hitting your F5 key. Depending on the nature of the stock you are modeling, you will likely want to include other variables, such as RSI, momentum, or volatility to improve the predictive performance of the models. You might also consider including other stocks that perform similarly or that are contained within the same sector, measurements of interest rates, or even entire indices of broad market behavior. Doing so can improve on an already profitable system such as the TFS.
--Rick Heymann, Senior AnalystBioComp Systems, 425 869-6770
rickh@biocompsystems.com
https://www.biocompsystems.com
GO BACKHere is the EDS code for AIQ TradingExpert that implements the indicators given in Bryan Strain's "How To Get In With The Trend And Out At The End" in this issue.
This code is also available from AIQ's Website and from STOCKS & COMMODITIES' Website as a downloadable EDS file.Tether is (HiVal([high],50) + LoVal([low],50))/2. VolOsc is SimpleAvg( IFF([close] > [open], [volume], IFF([close] < [open], [volume]*-1,0)),7). MBOInd is SimpleAvg([close],25) - SimpleAvg([close],200). ! Buy rule for tether if close crosses above the Tether Line BuyTether if (Val([close],1) < ValResult(Tether,1)) and ( [close] > Tether). !Sell rule for tether if close crosses below the Tether Line SellTether if (Val([close],1) > ValResult(Tether,1)) and ( [close] < Tether). !Confirming rules for Tether crossover. ! Volume Oscillator above zero GoodVolOsc if VolOsc > 0. ! and today's MBO greater than yesterdays GoodMBOInd if MBOInd > ValResult(MBOInd,1). ! The "BUY" rule Buy if BuyTether and GoodVolOsc and GoodMBOInd. ! The "Exit" rule Sell if SellTether.--Dale Paul, AIQ Systems800 332-2999, https://www.aiq.com
GO BACKTo implement in NeuroShell Trader the trend-following system given by Bryan Strain in "How To Get In With The Trend And Out At The End," you should first create the three component indicators. Select "New Indicator" from the Insert menu to create each of the following indicators using the Indicator Wizard:
The second step in implementing the trend-following system in NeuroShell Trader is to create a NeuroShell Trading Strategy. Select "New Trading Strategy" from the Insert menu and enter the following entry and exit conditions in the appropriate locations of the Trading Strategy Wizard:Tether Line: Price Midpoint ( High, Low, 50 ) Volume Oscillator: MovAvg( If A>B(Close,Open) Then Volume ElseIf A<B(Close,Open) Then Sub(0,Volume) Else 0, 7) MBO Indicator: Simple: Avg1 - Avg2 ( Close, 25, 200 )If you have NeuroShell Trader Professional, you can also choose whether the system parameters should be optimized. After backtesting the trading strategy, use the "Detailed AnalysisÉ" button to view the backtest and trade-by-trade statistics for this system.Generate a buy long MARKET order if ALL of the following are true: A>B ( Close, Tether Line ) ) A<B ( Lag(Close,1), Lag(Tether Line, 1) ) A>B ( Volume Oscillator, 0 ) A>B ( MBO Indicator, Lag(MBO Indicator,1)) Generate a sell long MARKET order if ALL of the following are true: A<B ( Close, Tether Line) )Users of NeuroShell Trader can go to the STOCKS & COMMODITIES section of the NeuroShell Trader free technical support Website to download an example of the trend-following system. For more information on NeuroShell Trader, visit www.NeuroShell.com.
--Marge Sherald, Ward Systems Group, Inc.301 662-7950, sales@wardsystems.com
https://www.neuroshell.com
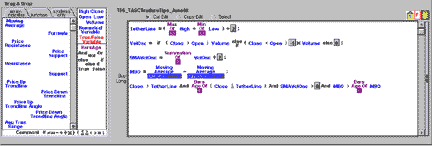
GO BACKByte Into The Market uses a drag-and-drop graphical editor. Icons are used to construct expressions. Click on the icon to adjust icon parameters using graphical controls.
FIGURE 1: BYTE INTO THE MARKET. This shows the trade system editor in Byte Into The Market with the buy long rule for the TFS system. Icons are dragged from the palette on the left and dropped into the editor window on the right.
Figure 1 shows the trade system editor in Byte Into The Market with the buy long rule for the TFS given by Bryan Strain in "How To Get In With The Trend And Out At The End." Icons are dragged from the palette on the left and dropped into the editor window on the right. The exit rule is simply the expression Close < TetherLine.
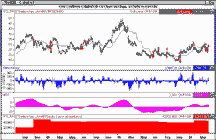
The system is also available for download at https://www.tarnsoft.com/TFS_TASC_June00.zip, or follow links from https://www.tarnsoft.com. Also contained in the zip archive download is a chart template/layout to help you analyze the system. As shown in Figure 2, new charts created from the template contain prices, the tether line, TFS signals, the volume oscillator, MBO indicator, and an equity curve for the system. As Strain duly noted, the filters necessary to reduce whipsaw trading from this system may leave you on the sidelines during some big moves.FIGURE 2: BYTE INTO THE MARKET. Charts created from the template contain prices, the tether line, TFS system signals, the volume oscillator, MBO indicator, and an equity curve for the system. --Tom Kohl, Tarn Software, 303 794-4184bitm@tarnsoft.com, https://www.tarnsoft.com
GO BACKThis month in Traders' Tips, we code the indicators presented by Bryan Strain in "How To Get In With The Trend And Out At The End" for use in Investor/RT. The indicators, the volume oscillator and Mbo indicator, are then combined to form the trend-following system.
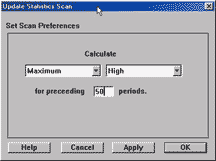
FIGURE 3: INVESTOR/RT, TETHER LINE. Use the Stat function in Investor/RT to request the maximum high and minimum low over 50 periods to create the tether line.
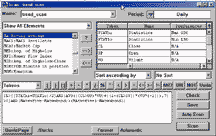
FIGURE 4: INVESTOR/RT, TREND-FOLLOWING SYSTEM. Each of the expressions are combined with an and in a form that renders a true/false statement that filters for securities that register the TFS buy signal.
The tether line
Here, we use the Stat function in Investor/RT to request the Maximum High and Minimum Low over 50 periods (Figure 3).CL>((STAThi+STATlo)/2)Here, we take the current difference of the 25-day moving average and 200-day moving average and subtract from it the difference one day ago. Name the moving averages (here, I've used twohund and twofive) for quick reference.Volume Oscillator (AVG(((CL>OP)*VO)+((1-(CL>OP))*(VO*(-1))),7) >0) MBO Indicator (MAtwofive-MAtwohund)>(MAtwofive1-MAtwohund1)Trend-following system
Each of the expressions are combined with an and in a form that renders a true/false statement that filters for securities that register the TFS buy signal (Figure 4):
CL>((STAThi+STATlo)/2)
AND (AVG(((CL>OP)*VO)+((1-(CL>OP))*(VO*(-1))),7) >0)
AND (MAtwofive-MAtwohund)>(MAtwofive1-MAtwohund1)
--Eric HynnimanLinn Software, 800 546-6842
sales@linnsoft.com, https://www.linnsoft.com
GO BACKThe three indicators that Bryan Strain presents this month in "How To Get In With The Trend And Out At The End" can be replicated using a combination of SmarTrader's prepreprogrammed studies, functions, and some user-generated formulas.
First, we will calculate the tether line. The SmarTrader specsheet showing the calculations is in Figure 5. Row 8 determines the 50-day high, and row 9 determines the 50-day low. Row 10, labeled tether, computes the midpoint of the two.
FIGURE 5: SMARTRADER. This SmarTrader specsheet calculates the tether line, volume oscillator, and MBO indicator for Bryan StrainÕs trend-following system.
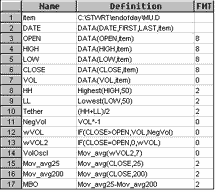
The creation of the volume oscillator, VolOscl, requires four steps. Row 10, NegVol, generates a negative volume number for use when CLOSE < OPEN. Row 12, wVOL, is an IF statement that establishes a positive volume if CLOSE > OPEN, else a negative volume by returning NegVol. Row 13, wVOL2, is another IF that returns a value of zero if CLOSE = OPEN, else the previous positive or negative volume established in wVOL. Finally, row 14, VolOscl, runs a seven-day simple moving average of wVOL2.MBO requires that we first run a simple moving average on the close for 25 days, row 15, and another simple moving average, row 16, on the close for 200 days. Row 17, MBO, is a user row subtracting Mov_avg200 from Mov_avg25.
--Jim Ritter, Stratagem Software International504 885-7353, E-mail: Stratagem1@aol.com
Internet: https://www.stratagem1.com.
The following WAVE WI$E formulas show how to compute the TFS system described in Bryan Strain's article "How To Get In With The Trend And Out At The End."
WAVE WI$E spreadsheet formulas
A: DATE @TC2000(C:\TC2000V3\Data,IBM,Internat Business Mach,DB)
B: HIGH
C: LOW
D: CLOSE
E: OPEN
F: VOL
G: tether       (@MAX(HIGH,50)+@MIN(LOW,50))/2
H: volcalc      @IF(CLOSE>OPEN,VOL,@IF(CLOSE<OPEN,-VOL,0))
I: volAvg       @MAVG(VOLCALC,7)
J: mbo          @MAVG(CLOSE,25)-@MAVG(CLOSE,200)
K: signal       @SIGNAL(CLOSE,BUY,CLOSE>TETHER &
                VOLAVG>0 & MBO>MBO[-1], CLOSE<TETHER)
L: exits
M: color        @IF(SIGNAL>0,GREEN,WHITE)
N:
==========End Formulas
--Peter Di Girolamo, Jerome Technology908 369-7503, E-mail: jtiware@aol.com
https://members.aol.com/jtiware