EPREDICT.COM
If you would like to join a Web-based trading community where you can play the part of stock prognosticator yet remain anonymous, without having to post or read individual messages on message boards, then check out ePredict.com. Scott Pederson, CEO and founder of ePredict.com, came up with the idea that polling tends to create results close to price action. He labeled this concept systematic analysis, which is based on the premise that a relationship exists between what the majority of investors perceive and the activity of stock prices. ePredict.com gives you the opportunity to rate how you believe various equities will perform. Your ratings are then tallied with that of others to form a group consensus.

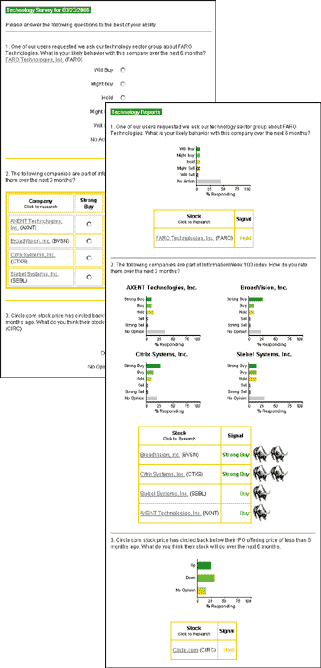
| FIGURE 1: EPREDICT.COM SURVEY. After filling out the ePredict.com survey to indicate how you believe certain stocks will fare É | FIGURE 2: EPREDICT.COM SURVEY RESULTS. Éyou will receive up-to-date results on all surveys completed by ePredict.com members. Survey results can help indicate investor sentiment. |
Since its launch on February 24, 2000, the Website has attracted thousands of users who fill out a survey every day and participate in a collective effort to make predictions on stocks. With the number of individual investors springing up at an incredible speed, it is no surprise the site has attracted a dedicated following.
Pederson includes the top 10% of stocks in his survey along with "hot stocks" that are being covered extensively by the media. This free service lets members predict the future performance of certain stocks on a daily basis and displays the compiled results.
You receive the survey by E-mail. A sample survey is in Figure 1. It's in multiple-choice format, and you are asked to rate the stocks in the list based on how you predict they will perform within a given future period, whether that be one month, three months, six months, or even a year. You can base your predictions on whatever method of analysis you choose, whether technical analysis or fundamental analysis. Once you respond to a survey, you receive the current survey results at the time you submit it or by E-mail. Results are presented as bar charts, making it easy to see where your predictions stand in relation to that of others. You can check the results again at day's end to get a more complete group consensus. Figure 2 shows the results of one survey.
One month after filling out your first survey, you can see the results of your ratings. To view your personal scorecard, go to the Clubhouse link from the home page.
Future additions include a members' tournament, scheduled to be operational by the time you read this. Tournament winners will receive a prize.
On the ePredict home page, you'll see a list of all the current strong buys and sells along with the return on investment (ROI) on those stocks (Figure 3). To the right, two simple bar charts report the overall success rate of member predictions with the percent of accurate and inaccurate predictions, divided into a general scoreboard and a technology scoreboard. In addition, you receive a weekly newsletter reporting the results relative to related broader indices. For example, the tech sector will be compared to the Nasdaq and the general sector to the S&P 500. To date, ePredict.com members have predicted individual stock performance with 70-90% accuracy. What's more, the surveyed stocks as a group have outperformed the Nasdaq Composite and S&P 500 indices.
FIGURE 3: EPREDICT.COM HOME PAGE. The home page displays a list of all the buy and sell recommendations as suggested by the daily member surveys.
Features are available on the ePredict.com Website for researching specific stocks. You can enter a stock symbol and receive quotes, charts, company snapshots, news, earnings estimates, and various other facts about the company. Most of this information comes from Market Guide.This is a fun site that makes you think about the direction of stock prices. Since members are traders and investors just as you are, you will find yourself looking forward to seeing the survey results after you've responded to a survey. Moreover, the surveys may include stocks that you never thought of trading, giving you new prospects for your watch list. If you have a question about a specific stock, you are encouraged to send E-mail to ePredict.com. The question may turn up in a future survey, giving you the opportunity to see what others think about a stock that interests you.
SPEEDRESEARCH.COM
With the vast array of Websites available for researching investments, it can be quite a chore to travel from one Website to the next to get all your information. For example, you may start out going to Briefing.com to look at the earnings calendar, then pay a visit to IPO.com to get information on upcoming IPOs, then on to Yahoo! Finance for stock quotes, then on to Ragingbull.com to participate in discussions. Managing all these sites from one page and being transported to them with the click of a mouse would indeed be a luxury.

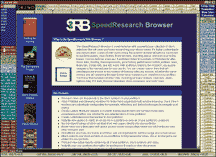
FIGURE 4: SPEEDRESEARCH.COM. This specialized financial Web browser contains five tabs allowing you to move easily from one window to the next. In addition to the Web browser window, you have a collection of buttons, each representing links, as well as the ability to create up to 10 portfolios.
Ron Kucynski had this idea in mind when he developed SpeedResearch.com. It's a specialized financial browser that allows you to customize the screen so that the Websites you visit to obtain all your information are just a click away.
This is a shareware program that you can try out for 30 days, after which you need to register and pay $34.99 if you wish to continue using it. The browser can be downloaded from the Website. After installation, which is a painless process, you are ready to run the program. You should install the program in the default directory. If you try to install it in any other directory, you might experience difficulties in opening the program.
SpeedResearch gives you the option of creating up to 10 portfolios. It isn't possible to cover all the many links included in SpeedResearch.com here, but you can visit just about any Website you wish from the SpeedResearch.com browser. You have the option of customizing the screen to include more than 40 URLs (Figure 4).
To begin, you'll want to first create your portfolios. Then you can click on any symbol in any of your portfolios to look up quotes, charts, discussions, analyst reports, news, options chains, short interest, insider trading or just about anything that you can find on the Internet, all with one mouse-click right from this page.
Along the bottom of the screen, you can see the quotes for the broader indices such as the DJIA, Nasdaq, and S&P 500. Positioning your mouse over any of the menus will display the full name of the Website specific to that menu.
SpeedResearch.com is a great tool for managing your personal finances. Most of the sites that are frequently visited by traders and investors are likely to already be included in the browser, and even if one isn't, you can add it as a custom link. For most convenient access to some of your favorite sites, you can assign Web pages to the five tabs that are prominently located across the top of the browser's main window. Then you can move between the Web pages quickly by clicking on the tabs. You can change these tab assignments anytime with a simple double-click of the mouse.
Just as with any new product, it takes a while to familiarize yourself with this browser, especially when you are accustomed to navigating with your default browser. Considering that there are so many links arranged around the browser window, and within some of these links are dropdown menus with more Websites, you have to play around with it until you uncover all the available links. SpeedResearch has tried to organize the layout by arranging the links by categories (such as news, research, IPOs, day trading, options and futures, and so on), but it can still take time to remember where each link is located. In fact, don't be surprised to discover later that a built-in link already existed for one you just added.
Kucynski has plans for more features, such as being able to sort the stock symbols and change their display colors individually. Another addition in the planning stage is providing users with the ability to create dropdown lists from custom links. This will provide users with the option of adding even more Website links.
SpeedResearch.com lacks some of the sophisticated features, such as the Find function, that are found in the more popular browsers such as Internet Explorer and Netscape Navigator. But in spite of such limitations, this browser is a worthwhile tool for individual investors.
Originally published in the June 2000 issue of Technical Analysis of STOCKS & COMMODITIES magazine. All rights reserved. © Copyright 2000, Technical Analysis, Inc.