Bollinger Band Targets
by Benjamin L. Cotton
You can calculate the future price movement necessary to cross a moving standard deviation band condition such as a Bollinger Band, removing the guesswork from systems trading on such relationships. Here's the logic behind such an indicator as well as the TradeStation programming that makes it work.
My November 1999 article for STOCKS & COMMODITIES introduced the BogieMA, an indicator that solves for the future price that would trigger a moving average crossover. This type of indicator saves traders from plugging in a best-guess price in a database until a trade is simulated. However, moving average relationships are relatively simple to solve; systems that utilize more complex relationships can be much more difficult to solve. I've done the work for you for one of the most popular indicators around, Bollinger Bands.
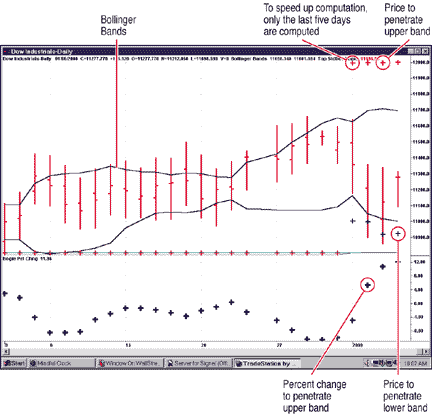
FIGURE 1: BOLLINGER BOGIES. The prices necessary to penetrate the Bollinger Bands may be off the chart as they are here for the upper band, but you can plot them directly on the price bars using code provided.
To do this, I used two standard deviation bogie indicators. These indicators solve for the price movement necessary to trigger a standard deviation band (such as Bollinger Bands) using the following rule:
- If close falls two standard deviations below/above a 30-day moving average, then sell/buy on close.
Here's the underlying relationship. The mean formula (equation 1), the standard deviation formula (equation 2), and the relationship we are solving (equation 3) can be seen below:
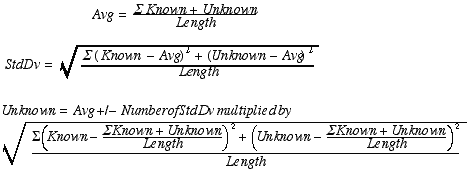
Unfortunately, the quantitative prowess necessary to solve the mathematical equality for the unknown is beyond most traders. I am no different, so I have not been able to isolate the unknown price. But the structure of the restatement below (equation 4) reveals a great deal about our bands:
![]()
Those who remember high school algebra will recognize equation 4 as a quadratic equation. As such, our relationship may have a single answer, two answers, or even no answer, making our trading rule tricky to implement or even interpret.
SOLVATION -- SO TO SPEAK
Solving a quadratic by simulation isn't the usual method of creating an indicator, but it can work. Here's the code for the upward crossing and the downward crossing, but you should review the indicators and learn the logic behind this simulation technique. (Subscribers can download the code from S&C's Website at https://technical.traders.com/sub/sublogin.asp.) Simulations are essential when the underlying equation cannot be untangled easily. Here are certain characteristics that warrant mentioning.
The input [Step(0.01)] tells the simulation to adjust the price in increments of one cent until the solution is found. Higher settings will speed up the indicator, but accuracy will be sacrificed.
The two primary loops evaluate the last known close in relation to the start value to determine if the forecast will step up/down toward the band.
Each primary loop contains a secondary "While ... Begin" loop that continually adjusts the unknown price and the standard deviation until the first solution is found or the distance between the unknown price and the band is determined to be no longer decreasing (the vertex is reached).
The sum of the squares, "For/Begin" loops within the secondary loops, is set to sum the known squares. The unknown square is added outside this loop.
Pay careful attention to how the distance and the unknown price are calculated. The sign (+/-) changes depending upon which band (top/bottom) is being evaluated and where the last known price is located relative to the last known band.
{*************************************************************************
Description: Simulates for condition needed to cross top standard deviation band
Provided By: Benjamin L. Cotton
*************************************************************************}

Inputs: Length(15), NStDv(2), Step(.01); Variables: SumSqr(0), Avg(0), Counter(0),
Simcntr(0), Unknown(0), Std_Dev(0), Top(0), T_Solve(0), Last(0), Distance(0),
How(0), Percent(0), Start(0);

Avg = (Summation(Close, Length-1) + Close) / Length; SumSqr = 0;
For Counter = 0 To Length - 2 Begin
                SumSqr = SumSqr + (Close[Counter] - Avg) * (Close[Counter] - Avg);
End;
SumSqr = SumSqr + (Close - Avg) * (Close - Avg); Std_Dev = SquareRoot(SumSqr / Length);
Start = Avg + Std_Dev * NStDv;

Unknown = Close;
Last = Close;
Simcntr = 0;
T_Solve = 0;
Avg = 0;

If Close < Start then Begin
        While T_Solve = 0 Begin
                Unknown = Unknown + Step;
                Avg = (Summation(Close, Length-1) + Unknown)/ length;
                SumSqr = 0;
                For Counter = 0 To Length - 2 Begin
                        SumSqr = SumSqr + (Close[Counter] - Avg) *
(Close[Counter] - Avg);
                End;
                SumSqr = SumSqr + (Unknown - Avg) * (Unknown - Avg);
                Std_Dev = SquareRoot(SumSqr / Length);
                Top = Avg + Std_Dev * NStDv ;
                Distance = (Top - Unknown);
                If Distance = 0 then T_Solve = Unknown;
                If Distance = 0 then How = 1;
                If Simcntr > 1 then begin
                        If Distance < 0 then T_Solve = Unknown - Step;
                        If Distance < 0 then How = 1;
                        If Distance > Last then T_Solve = Unknown - Step;
                        If Distance > Last then How = 0;
                End;
                Last = Distance;
                Simcntr = simcntr + 1;
        End;
End;

If Close > Start then Begin
        While T_Solve = 0 Begin
                Unknown = Unknown - Step;
                Avg = (Summation(Close, Length-1) + Unknown)/ length;
                SumSqr = 0;
                For Counter = 0 To Length - 2 Begin
                        SumSqr = SumSqr + (Close[Counter] - Avg) *
(Close[Counter] - Avg);
                End;
                SumSqr = SumSqr + (Unknown - Avg) * (Unknown - Avg);
                Std_Dev = SquareRoot(SumSqr / Length);
                Top = Avg + Std_Dev * NStDv ;
                Distance = (Unknown - Top);
                If Distance = 0 then T_Solve = Unknown;
                If Distance = 0 then How = 1;
                If Simcntr > 1 then begin
                        If Distance < 0 then T_Solve = Unknown + Step;
                        If Distance < 0 then How = 1;
                End;
                Last = Distance;
                Simcntr = simcntr + 1;
        End;
End;

If Close = Start then T_Solve = Close
If Close = Start then How = 1

Percent = (T_Solve/Close - 1)*100;

Plot1(T_solve,"Bogie TStdev");
Plot2(Percent,"PrcntChng");
Plot3(How,"How");


{****************************************************************************
Description: Simulates for condition needed to cross bottom standard deviation band
Provided By: Benjamin L. Cotton
*****************************************************************************}

Inputs: Length(15), NStDv(2), Step(.01); Variables: SumSqr(0), Avg(0), Counter(0),
Simcntr(0), Unknown(0), Std_Dev(0), Bottom(0), B_Solve(0), Last(0), Distance(0),
How(0), Percent(0), Start(0);

Avg = (Summation(Close, Length-1) + Close) / Length; SumSqr = 0;
For Counter = 0 To Length - 2 Begin
        SumSqr = SumSqr + (Close[Counter] - Avg) (Close[Counter] - Avg);
End;
SumSqr = SumSqr + (Close - Avg) * (Close - Avg); Std_Dev = SquareRoot(SumSqr / Length);
Start = Avg + Std_Dev * NStDv;

Unknown = Close;
Last = Close;
Simcntr = 0;
B_Solve = 0;
Avg = 0;

If Close > Start then Begin
        While B_Solve = 0 Begin
                Unknown = Unknown - Step;
                Avg = (Summation(Close, Length-1) + Unknown)/ length;
                SumSqr = 0;
                For Counter = 0 To Length - 2 Begin
                        SumSqr = SumSqr + (Close[Counter] - Avg) *
(Close[Counter] - Avg);
                End;
                SumSqr = SumSqr + (Unknown - Avg) * (Unknown - Avg);
                Std_Dev = SquareRoot(SumSqr / Length);
                Bottom = Avg - Std_Dev * NStDv ;
                Distance = (Unknown - Bottom);
                If Distance = 0 then B_Solve = Unknown;
                If Distance = 0 then How = 1;
                If Simcntr > 1 then begin
                        If Distance < 0 then B_Solve = Unknown + Step;
                        If Distance < 0 then How = 1;
                        If Distance > Last then B_Solve = Unknown + Step;
                        If Distance > Last then How = 0;
                End;
                Last = Distance;
                Simcntr = simcntr + 1;
        End;
End;

If Close < Start then Begin
        While B_Solve = 0 Begin
                Unknown = Unknown + Step;
                Avg = (Summation(Close, Length-1) + Unknown)/ length;
                SumSqr = 0;
                For Counter = 0 To Length - 2 Begin
                                SumSqr = SumSqr + (Close[Counter] - Avg) *
(Close[Counter] - Avg);
                End;
                SumSqr = SumSqr + (Unknown - Avg) * (Unknown - Avg);
                Std_Dev = SquareRoot(SumSqr / Length);
                Bottom = Avg - Std_Dev * NStDv ;
                Distance = (Bottom - Unknown);
                If Distance = 0 then B_Solve = Unknown;
                If Distance = 0 then How = 1;
                If Simcntr > 1 then begin
                        If Distance < 0 then B_Solve = Unknown - Step;
                        If Distance < 0 then How = 1;
                End;
                Last = Distance;
                Simcntr = simcntr + 1;
        End;
End;

If Close = Start then B_Solve = Close;
If Close = Start then B_Solve = Close;

Percent = (B_Solve/Close - 1)*100;

Plot1(B_solve,"Bogie BStdev");
Plot2(Percent,"PrcntChng");
Plot3(How,"How");
Benjamin L. Cotton is part of the pension asset management team at Ford Motor Company. Previously, he was a research/portfolio manager for SAI Capital Management. He is a member of the Association for Investment Management and Research, the Los Angeles Society of Financial Analysts, and is a Chartered Financial Analyst charterholder. He can be reached via E-mail at bcotton2@ford.com.
Excerpted from an article originally published in the July 2000 issue of Technical Analysis of STOCKS & COMMODITIES magazine. All rights reserved. © Copyright 2000, Technical Analysis, Inc.
Return to July 2000 Contents