CLASSIC TECHNIQUES
The Strength Of Support And Resistance
Measuring Overhead Supplyby Christopher Narcouzi
Here's how to quantify support and resistance so you can get a good idea ahead of time whether they will hold up when tested.
Stocks run up and down between support and resistance lines. Sometimes they break through support and resistance, and sometimes they back off. Usually, they back off if the support or resistance is very significant. You can quantify support and resistance using volume around previous tops and bottoms. Here's how to measure the significance of support and resistance so you can get a good idea ahead of time whether they will hold up when tested.

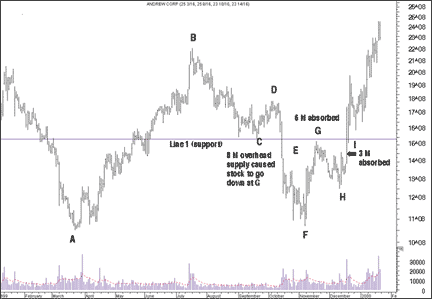
FIGURE 1: ANDREW CORP. Andrew supporters accumulated 8 million shares around C but became sellers when support was broken. Subsequent moves up could not succeed until that supply had been absorbed at G and I.
SUPPORT AND RESISTANCE ZONES
Some people treat support and resistance as exact points. If the resistance line is at $75 and the stock rallies to $76, then they consider resistance to be broken. This is not correct. Resistance should be expected in the vicinity of $75. The stock may meet resistance anywhere between $73 and $77. Support and resistance should be considered approximate areas and not precise points. Think of support and resistance as zones.
In this case, volume is the key, best illustrated with an example. Take a look at Figure 1. The stock started a bull move and went up from around $11 at point A to around $23 at point B. At B, sellers became motivated and drove the stock down to a low of around $16 to point C. If you add up the volume around the bottom at C, you will see that approximately eight million shares changed hands around C. These new shareholders bought the stock around $16 to $18.50.
The stock subsequently broke support at line 1 at point E and plunged to a low of about $11 at point F. What happened to the shareholders who supported the stock and bought shares between $16 and $18.50? They found themselves staring at a loss of more than 31%! These shareholders will no doubt be looking for the first opportunity to sell their stock and break even.
What happens when the stock approaches resistance at line 1? How many shares would you expect to be offered for sale? Up to eight million shares may be put for sale by the shareholders who bought at C and now are trying to break even. The eight million shares around the bottom are referred to as overhead supply.
Actually, when the stock tested the resistance at line 1 at point G, six million shares of overhead resistance were absorbed. You can find this by adding up the volume around the top at point G. Still, two million shares of overhead supply were left out of the eight million.
The overhead supply drove the stock down to point H around $13. At that time, buyers became motivated and drove the stock back up. When the stock retested resistance at line 1, three million shares were absorbed on the day of breakout at point I.
The last part of the eight million shares of overhead supply around the bottom at point C were absorbed at point I, and as a result, the stock breakout above resistance at line 1 was successful.
Using volume, you can quantify the overhead supply. To get the overhead supply, you add up the volume at the previous bottom. In Figure 1, the previous bottom is at point C. If 15 million shares were traded around the bottom at point C, then resistance at line 1 would have been much more formidable and the stock would have not been able to break out above it successfully at point I. In this case, a third try may be warranted.
Christopher Narcouzi is a systems program and Unix administrator in Quincy, MA. He can be reached at cnarcouz@erols.com.
Excerpted from an article originally published in the July 2000 issue of Technical Analysis of STOCKS & COMMODITIES magazine. All rights reserved. © Copyright 2000, Technical Analysis, Inc.
Return to July 2000 Contents