BASIC TECHNIQUES
Volume Basics
by Martin J. Pring
How is volume used in technical analysis and what can it tell us?
Most of the indicators used in technical analysis are based on pricing data. We either use the prices themselves, a statistical manipulation of the prices with moving averages, or oscillators of some kind. Volume, though, is an independent variable and can therefore be extremely useful in confirming price action. There are many ways of using volume, such as the construction of oscillators, on-balance volume lines, and the designing of indicators using both volume and price. I will discuss some of these more sophisticated variations of volume analysis in future articles. In this one, however, I will concentrate on the basics.

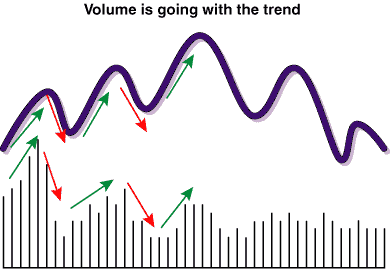
FIGURE 1: VOLUME PLAYS. In a normal market, volume normally rises with price increases and falls with price decreases.
PERFECT BALANCE
First, it is important to understand there is always a perfect balance between buyers and sellers because the amount of a security sold is always identical to that which is purchased. What moves prices is the relative enthusiasm of buyers and/or sellers. If sellers are more motivated than buyers, then the price will decline. If buyers are more motivated than sellers, then the price will rise.
Volume is usually displayed in charts as a series of histograms underneath the price. This is a useful form of presentation, since it reflects expansions and contractions in activity. There are several key principles used in interpreting volume, but before I analyze them, it is important to understand that when I talk about changes in the level of volume, I am referring to volume changes relative to the recent past.
For example, it's impossible to compare the volume on the New York Stock Exchange (NYSE) today when it's in the hundreds of millions with the volume at the start of the 20th century when it was less than one million. This is because there are far more shares listed now. Activity has also grown because of futures and options arbitrage, and reduced commission charges allow more frequent trading as well. But you can compare high volume this week with volume two weeks ago. Here's a brief overview of some of the basic principles of volume interpretation:
VOLUME SHOULD GO WITH THE TREND
When prices are rising, it is normal for volume to expand, and when prices are declining, volume typically contracts, as can be seen in Figure 1.
Martin J. Pring founded the International Institute for Economic Research in 1981. He is the author of several books, including the classic Technical Analysis Explained, and Introduction To Technical Analysis, the first technical analysis multimedia CD-ROM. He pioneered the introduction of videos as an educational tool for technical analysis in 1987, and was the first to introduce educational interactive CDs in this field. His Website is https://www.Pring.com, and he may be reached at info@Pring.com.
Excerpted from an article originally published in the July 2000 issue of Technical Analysis of STOCKS & COMMODITIES magazine. All rights reserved. © Copyright 2000, Technical Analysis, Inc.
Return to July 2000 Contents