NOVICE TRADER
What Can We Learn From A Close Examination Of Chart Patterns? Read This For A Few Ideas
Chart Pattern Surprises
by Thomas Bulkowski
What chart patterns are really reliable, portending significant moves? This S&C author did some research, and we present the results from his survey of some 15,000 patterns.
In exploring and answering questions about the stock data we follow and the technical tools we use, sometimes we make startling discoveries. These discoveries may help you improve your investment performance or just add to your general knowledge. I spent a year studying more than 15,000 chart patterns while I was working on my book, Encyclopedia Of Chart Patterns. Of the dozens of surprises I uncovered, here are a few that you may find revealing and useful.
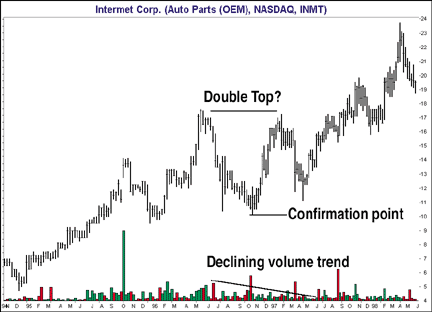
FIGURE 1: DOUBLE TOP? If you think you see a double top, wait for the breaking of the neckline to increase the possibility of a successful trade.
ABOUT DOUBLE TOPS
The failure rate of a double top is 65%, but waiting for confirmation cuts it to just 17%.
Figure 1 shows a twin-peak formation on a weekly scale that many would say is on its way to becoming a double top. Here, prices trend upward beginning in December 1994 on their way to the first peak in May 1996. The two peaks are close to the same price, 17-5/8 and 17-1/4, with a decline between them that appears relatively smooth (but then, an irregular appearance is common). Prices decline between the two peaks by 43%, well above the 10% to 20% minimum. Volume is higher on the left peak than on the right as expected, with an overall downward trend denoted by the descending volume line. After the right top, prices head down, but only reach 11-1/8 before reversing course and making a new high near 24 a year later.
Of the 1,280 twin-peak formations I looked at in five years of daily price data, 826, or 65%, acted just like the one shown. I do not consider them to be double tops because prices do not decline below the confirmation point, which is the lowest point between the two peaks. If you wait for prices to close below the confirmation point, the failure rate drops to just 17%. This means that 83% of the time, prices continue moving down by more than 5%.
It's easy to explain the high failure rate of twin-peak formations to decline below the confirmation point: It's called a bull market. I conducted the study using data from mid-1991 to 1996, a time when the Standard & Poor's 500 nearly doubled.
Three other surprises for double tops I discovered are that tops closer together, tops with deep troughs, and double tops with high-volume breakouts all show larger price declines; in other words, they are better-performing double tops.
Thomas Bulkowski has a bachelor's degree in computer engineering and uses his software engineering skills to further his full-time investment activities. He may be reached via E-mail at tbul@hotmail.com.
Excerpted from an article originally published in the September 2000 issue of Technical Analysis of STOCKS & COMMODITIES magazine. All rights reserved. © Copyright 2000, Technical Analysis, Inc.
Return to September 2000 Contents