INDICATORS
Of All The On-Balance Volume Indicators, Which Is The Best?
Using Oscillators With On-Balance Volume
by Carl F. Ehrlich
On-balance volume, which was developed by technician Joe Granville in the 1960s, was the first technical study to project market price movement using volume. In the following decades, other technicians have attempted to improve on Granville's work. Here's a review of these different studies in accumulation and distribution, and a methodology to utilize them in a trading program.
When Joseph Granville originally published A Strategy Of Daily Stock Market Timing For Maximum Profit in 1960, the work initially met with derision from the traditional investment world. He had the last laugh, though, because you can find Granville's methodology in all trading software today, as well as in a myriad of books on the subject of technical analysis. In all those places, you will find the results of his work, but his own words describing his concept are much harder to find. That's something I can share with you.

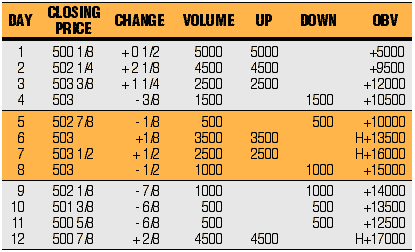
FIGURE 1: OBV. The traditional computation of on-balance volume adds the day's volume to the running sum if the price is above the previous day's close and subtracts it from the sum if the close is below the previous day's close.
Granville recognized that volume was the force that moved markets, and so he created an indicator he called on-balance volume (OBV) to project when major market moves would occur. He described the increase or decrease of his indicator, setting new highs or lows, as "a spring being wound tightly."
He explained that when the accumulation or distribution of volume occurred without significant price change, the market would react much the same way that a tightly wound spring would. At some point, the market would burst in the way that the spring would, and this action would carry price with it. He also defined how to identify the time frame in which the spring was ready to pop by identifying highs and lows set by the increase and decrease in the OBV number. When a series of new highs or lows have been set and price has not moved accordingly, the spring is ready to be released.
As it turned out, Joe Granville was both correct and ahead of his time.
ON-BALANCE VOLUME
Although today all major technical analysis software performs the on-balance volume calculations and provides it in the form of a graph, Granville's method is easy to figure and follow by hand. The rule is as follows: If the tradable closed up today, all volume is assigned to the up column. If the security closed down today, all volume is assigned to the down column. The third and only other column is the on-balance volume and is simply the running total of the sum of the columns. A sample of what this would look like for soybeans can be found in Figure 1.
As Figure 1 illustrates, a third high has been set without an intervening low, and price has barely changed from the start of the study. A signal has been issued. OBV has more than tripled, yet price has moved up a meager three-quarters of a cent. Clearly, the spring is ready to pop on the soybean contracts.
Carl F. Ehrlich is a futures broker with Alaron Trading of Chicago, IL. He utilizes traditional technical indicators along with the concept of accumulation/distribution to both daytrade and position trade the futures markets. He can be reached via E-mail at carl_ehrlich@hotmail.com, at 800 464-1255, via the Alaron Website at https://www.Alarontrading.com, or at his own at https://www.advancedtrading.com.
Excerpted from an article originally published in the September 2000 issue of Technical Analysis of STOCKS & COMMODITIES magazine. All rights reserved. © Copyright 2000, Technical Analysis, Inc.
Return to September 2000 Contents