TRADERBOT.COM
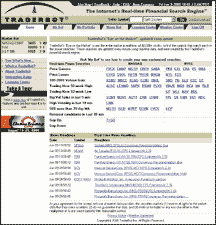
Talk about reducing the learning curve: For traders who are not inclined to write code and create custom formulas for screening stocks, here's a site that will solve your problems. Traderbot.com (Figure 1) is a real-time financial search engine designed to increase the amount of discipline required by trading. Once you sign up for the service, which costs $40 a month or $20 a month if you prepay for a year, you can specify a search criterion for identifying specific trading patterns. A list of all stocks that meet the specified criteria will be displayed on your screen within seconds.

FIGURE 1: TRADERBOT.COM HOME PAGE
Since its launch on April 18, 2000, the Website has attracted a dedicated following and has plans to add several new features. Recently, a filter for screening by sector was added.
Although Traderbot.com gives you the flexibility to create your own screening criteria, it also includes some prebuilt searches that are displayed on the home page. These include price gainers and losers; volume gainers; stocks trading at their 52-week highs/lows; volume spikes in the last five minutes; high volatility in last 10 minutes; reversal candidates; and gaps. The stocks that meet the specific criteria are listed and a click on any of them will display a real-time intraday chart with details such as last price, change, bid, ask, volume, and so on. The latest headlines for the specific stock are also displayed. You have the option of changing the time period of the chart, viewing the company fundamentals, and the time and sale of the last trade.
Traderbot.com includes an interactive demo as well as a learning center where you can familiarize yourself with the techniques used to build the search criteria. The interactive demo does a great job of walking you through the necessary steps involved in editing the search criteria.
The various sections of the site are arranged horizontally across the top of the Web page as tabs. A click on "My Bot" will take you to a page where you can customize your power searches and edit the already existing built-in searches. For the built-in criteria, you have two options: edit and find. A click on the edit button will give you the flexibility to define your price range, volume traded, price gains, P/E ratio, price relative to moving averages, select specific exchanges, the number of results to return, and the refresh time (one-, two-, or five-minute intervals). Once you are done editing, click the find button and a list of all stocks meeting your search will be displayed.
FIGURE 2: TRADERBOT.COM CUSTOMIZABLE POWER SEARCH. Once you enter the search criteria by selecting your desired options...
You can also customize power searches where you can select criteria based on basic parameters, price action, volume action, bid and ask, technical indicators, fundamentals, news, or industry sectors. An example of the "customize power search" template is displayed in Figure 2. After successfully creating a search, you can save it to include in your criteria list. The results of your search will be displayed as a list in Figure 3.
FIGURE 3: TRADERBOT.COM SEARCH RESULTS. Éa list of stocks meeting your criteria will be displayed.
You can also create multiple portfolios of your stocks. A list of stocks in your portfolio will be displayed as well as whether or not that stock meets any of your search criteria. Other information such as the last price, change, the bid and ask can also be displayed.
An alert feature for multiple criteria is included in this service. Alerts are indicated as checkmarks in boxes and there are plans to incorporate instant messaging systems.
Although the variables for creating custom searches may not be limitless, such as some of the search capabilities offered by sophisticated technical analysis software, Traderbot.com includes enough features to create meaningful searches. The speed at which the "bot" is able to scan markets and spit out results in real time is what sets this site apart.
SPEAKEASYINVESTOR.COM
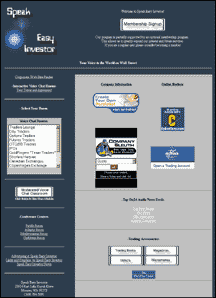
With the growing popularity of holding virtual meetings over the Internet, it is no surprise to come across virtual technical analysis classrooms. Speakeasyinvestor.com (Figure 4) has taken advantage of this Internet technology and put together a Website where those interested in the subject can attend classes as well as participate in several of the available chatrooms. The services are free to anyone interested, but donations are gladly accepted. If you wish to participate in discussions, you need to install and run HearMe Voice Creator software. This enables you to listen and speak to others who are involved in the discussions, both in the classroom and chatrooms.

FIGURE 4: SPEAKEASYINVESTOR.COM
The classes typically have about 30 participants who can listen to the instructor and ask questions. While the class is going on, participants have the option of chatting online with others. This tends to get distracting, since some people attending the class are talking about other topics.
On the other hand, to be able to sit in front of your screen in the comfort of your home and participate in a class where you can listen to the instructor, view displays of charts, and ask others questions is indeed a luxury.
If you are interested in following any of the courses, a schedule is available on the Website. Prior to each class, the instructor will post an outline of the lesson. I attended an "Introduction to Technical Analysis" course, where different types of charts (for example, bar, candlesticks, and point and figure), indicators, and tools were discussed. The instructors at Speakeasyinvestor.com use charts from various sources, such as BigCharts and ClearStation. Daily, weekly, and monthly charts of the broader indices were displayed. Indicators such as MACD and moving averages were discussed. The instructor, Shawn Greer, inserted trendlines, MACD, and moving averages on the charts and taught the students how to utilize each indicator in making buy and sell decisions. Greer stressed that having at least two indicators generating similar signals increases the strength of the signal.
Speakeasyinvestor.com plans on expanding their services by increasing the number of classes and inviting guest speakers. It has attracted a dedicated following since its launch and hopes to continue attracting more students.
Originally published in the September 2000 issue of Technical Analysis of STOCKS & COMMODITIES magazine. All rights reserved. © Copyright 2000, Technical Analysis, Inc.