or return to October 2000 Contents
You can copy these formulas and programs for easy use in your spreadsheet or analysis software. Simply "select" the desired text by highlighting as you would in any word processing program, then use your standard key command for copy or choose "copy" from the browser menu. The copied text can then be "pasted" into any open spreadsheet or other software by selecting an insertion point and executing a paste command. By toggling back and forth between an application window and the open Web page, data can be transferred with ease.
This month's tips include formulas and programs for:
or return to October 2000 Contents
The article "Ichimoku Charts" by Ken Muranaka in this issue introduces five formulas to construct an ichimoku chart. This type of chart can be easily recreated in MetaStock 6.52 or higher.
METASTOCK
Select Indicator Builder from the Tools menu, select New, and enter the following formula:
GO BACKNext, locate the ichimoku chart indicator in MetaStock's indicator builder.Name: Ichimoku Chart ST:=(HHV(H,26)+LLV(L,26))/2; TL:=(HHV(H,9)+LLV(L,9))/2; DL:=Ref(C,+25); 1Span:=Ref((ST+TL)/2,-25); 2Span:=Ref((HHV(H,52)+LLV(L,52))/2,-25); ST; TL; DL; 1Span; 2Span-- Cheryl C. Abram, Equis International, Inc.
https://www.equis.com
METASTOCK
You can use MetaStock 6.52 or higher to recreate the TC2000 scans described in "Playing The Breakouts: Gary B. Smith Of TheStreet.com" in this issue. To recreate the scans, select The Explorer from the Tools menu, click New, and in the filter column, enter the following formula:GO BACKTo run the exploration, select it from the list and click Explore.Name: LONGS (C>20) AND (Mov(V,50,S)>500) AND (C>Ref(HHV(C,5),-1)) AND (C>Ref(C,-1)+1) AND (V>1.5*Mov(V,50,S)) Name: SHORTS (C>20) AND (Mov(V,50,S)>500) AND (C<Ref(LLV(C,5),-1)) AND (C<Ref(C,-1)-1) AND (V>1.5*Mov(V,50,S))-- Cheryl C. Abram, Equis International, Inc.
https://www.equis.com
GO BACKIn his article "Normalization" in this issue, Brian Bell introduces some methods for normalizing indicators. These methods can be easily recreated in MetaStock 6.52 or higher.
METASTOCK
Select Indicator Builder from the Tools Menu, click New, and enter the formula for the desired method:
Note: To apply these methods to different indicators, replace the simple moving average oscillator portion with the desired indicator's formula.Name: Simple Moving Average Oscillator OscP(4,8,S,$) Name: Simple MA Osc norm to Std Dev OscP(4,8,S,$)/Stdev(C,8) Name: Simple MA Osc norm to Ave True Range OscP(4,8,S,$)/ATR(8) Name: Simple MA Osc norm to Historical Range OscP(4,8,S,$)/WillR(200)-- Cheryl C. Abram, Equis International, Inc.
https://www.equis.com
GO BACKIn John Sweeney's interview with Gary Smith in this issue ("Playing The Breakouts: Gary B. Smith Of TheStreet.com"), Smith discusses how he screens stocks using TC2000. The TC2000 scans can be recreated in AIQ TradingExpert using the following code:
AIQ TRADINGEXPERT
This code is also available from AIQ's Website as a downloadable EDS file.Long if ([close]>20) and (SimpleAvg([volume],50)>500) and ([close] > HiVal([close],5,1)) and ([close]>Val([close],1)+1) and ([volume]> 1.5 * SimpleAvg([volume],50)). Short if ([close]>20) and (SimpleAvg([volume],50)>500) and ([close] < LoVal([close],5,1)) and ([close]<Val([close],1)-1) and ([volume]> 1.5 * SimpleAvg([volume],50)).-- AIQ Technical Support
800 332-2999
https://www.aiq.com
GO BACKHere is the EDS code for AIQ TradingExpert that implements the normalization method from Brian Bell's article, "Normalization":
AIQ TRADINGEXPERT
This code is also available from AIQ's Website as a downloadable EDS file.! Normalization procedures ! Simple Moving Average ! {OscCalc,periods} / SimpleAvg(OscCalc,periods) ! Sample NormalizedMACDSMA is [MACD]/SimpleAvg([MACD],9). ! Standard Deviation ! {OscCalc,periods} / Sqrt(Variance(OscCalc,periods)). ! Sample NormalizedMACDStdDev is [MACD]/Sqrt(Variance([MACD],9)). ! Average True Range ! {OscCalc,periods}/ SimpleAvg(ATR,periods) ! Sample ATR1 is max([high]-[low],[high]-val([close],1)). ATR is max(ATR1,val([close],1)-[low]). NormalizedMACDATR is [MACD]/SimpleAvg(ATR,9). ! Own Historical Range ! 100 * ({OscCalc} - LoVal({OscCalc},N)/ (HiVal({OscCalc,N)-LoVal({OscCalc},N) ! Sample NormalizedMACDHistRange is 100 * ([MACD] - LoVal([MACD],200)) / (HiVal([MACD],200) - LoVal([MACD],200)).-- AIQ Technical Support
800 332-2999
https://www.aiq.com
GO BACKIn this issue's article "Ichimoku Charts," Ken Muranaka reviews a classic Japanese charting technique. In EasyLanguage, I have created two indicators to represent the ichimoku lines used in Muranaka's article. The indicators are named Ichimoku - Lines and Ichimoku - Cloud.
OMEGA RESEARCH EASYLANGUAGE
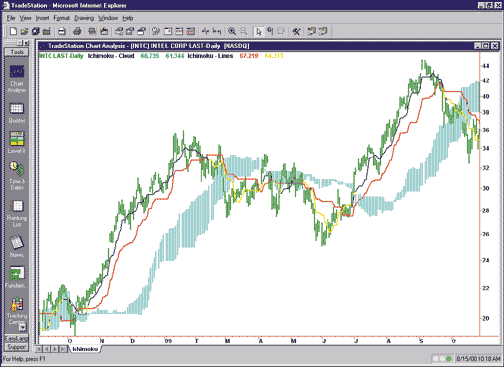
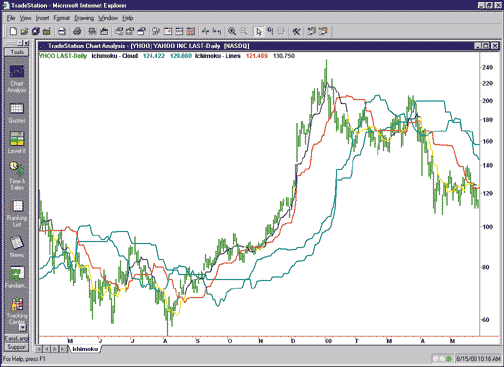
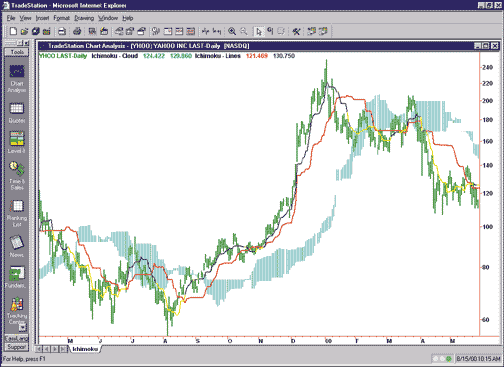
The Ichimoku - Lines indicator in EasyLanguage includes some additional logic that allows users to visually factor in the delayed line to make historical analysis easier. In addition, it can help to reduce the clutter on the chart from so many lines being drawn. In the article, Muranaka states that the "market has improved when the delayed line is above the closing prices at that past date." Thus, for this indicator, when the delayed line is above the closing prices at the past date, the turning line will be blue. When the delayed line is below the closing prices at the past date, the turning line will be yellow (Figures 1 through 4). The color change is controlled by the DelayColor input. By including this logic, we eliminate the need to display the delayed line. If you prefer not to see any color changes in the turning line, you can simply set the DelayColor input to the same color as that which is assigned to the turning line in the Format dialog. You can choose to display the delayed line by setting the ShowDelayLine input to true. The color for the delayed line is set in the Format dialog.
Here is the EasyLanguage used to create this indicator. The properties for the indicator are presented after the EasyLanguage.FIGURE 1: TRADESTATION, ICHIMOKU CHART, INTEL. This is a chart of Intel with the ichimoku indicators applied. The red line is the standard line. The blue/yellow line is the turning line (blue=delay line positive, yellow=delay line negative). The space between the cyan (bright blue) lines represents the cloud.

FIGURE 2: TRADESTATION, ICHIMOKU CHART, INTEL. This is a chart of Intel with the ichimoku indicators applied. The red line is the standard line. The blue/yellow line is the turning line (blue=delay line positive, yellow=delay line negative). The cyan (bright blue) sections represent the cloud (it is drawn as shown above by changing the bar style to bar high/bar low).

FIGURE 3: TRADESTATION, ICHIMOKU CHART, YAHOO!. This is a chart of Yahoo! with the ichimoku indicators applied. The red line is the standard line. The blue/yellow line is the turning line (blue=delay line positive, yellow=delay line negative). The cyan lines enclose the "cloud."

FIGURE 4: TRADESTATION, ICHIMOKU CHART, YAHOO!. This is a chart of Yahoo! with the ichimoku indicators applied. The red line is the standard line. The blue/yellow line is the turning line (blue=delay line positive, yellow=delay line negative). Cyan sections represent the cloud (it is drawn as shown above by changing the bar style to bar high/bar low).
Name: Ichimoku - Lines
Type: Indicator

Inputs: Standard(26), Turning(9), DelayColor(Yellow), ShowDelayLine(False);
Variables:StdLine(0), TurnLine(0), DelayLine(0);

StdLine = (Highest(High, Standard) + Lowest(Low, Standard)) / 2;
TurnLine = (Highest(High, Turning) + Lowest(Low, Turning)) / 2;
DelayLine = Close[Standard];

Plot1(StdLine, "Standard");
Plot2(TurnLine, "Turning");
If Close > DelayLine Then
        SetPlotcolor(2, Blue)
Else
        SetPlotColor(2, DelayColor);

If ShowDelayLine Then
        Plot3[Standard](Close, "Delayed");

Chart style:
PlotName        Style     Weight
Standard               Line         Thinnest
Turning                Line         Thinnest
Delayed                Line         Thinnest

Chart color:
PlotName         Color
Standard               Red
Turning                Blue
Delayed                Magenta

Scaling: Same as symbol.
The second indicator draws the preceding span lines or clouds. This indicator is named Ichimoku - Cloud. The indicator basically draws two cyan (bright blue) lines that represent the cloud. Please note that before applying this indicator to a chart, you must set the "space to the right" setting for the chart (in the chart format dialog) equal to or greater than the value of the "standard" input (26 is the default value).Here is the EasyLanguage used to create the Ichimoku - Cloud indicator. The properties for the indicator are presented after the EasyLanguage.
Name: Ichimoku - Cloud
Type: Indicator

Inputs: Standard(26), Turning(9), Delayed(52);
Variables:StdLine(0), TurnLine(0), Span1(0), SPan2(0);

StdLine = (Highest(High, Standard) + Lowest(Low, Standard)) / 2;
TurnLine = (Highest(High, Turning) + Lowest(Low, Turning)) / 2;
Span1 = (StdLine + TurnLine) / 2;
Span2 = (Highest(High, Delayed) + Lowest(Low, Delayed)) / 2;

Plot1[-Standard](Span1, "Span1");
Plot2[-Standard](Span2, "Span2");

Chart style:
PlotName        Style       Weight
Span1                   Line            Medium-thinnest
Span2                   Line            Medium-thinnest

Chart style:
PlotName        Color
Span1                   Cyan
Span2                   Cyan

Scaling: Same as symbol.
The EasyLanguage code for the ichimoku indicators described here is also available for download from Omega Research's Website. The filename is Ichimoku.ELS. (ELS files are for use in TradeStation and ProSuite 2000i.)-- Gaston Sanchez, EasyLanguage Expert
Omega Research Inc.
800 422-8587, 305 270-1095
https://www.omegaresearch.com
GO BACKIn this issue, Jack Singer describes a fund-switching strategy in "Enhanced Fund Switching." The indicator that Singer describes as the basis of his fund-switching strategy has been reproduced in a custom buy indicator in NeuroShell Trader. A sell indicator was also created as an extension of Singer's research. Users of NeuroShell Trader can go to the STOCKS & COMMODITIES section of the NeuroShell Trader free technical support Website to download the two indicators, the source code, and an example chart.
NEUROSHELL TRADER
NeuroShell Trader Professional allows users to build even complicated indicators in standard languages such as C and Basic. We have programmed Jack Singer's indicator in Power Basic so that it becomes an integral part of NeuroShell Trader. Users can modify the source code and optimize parameters, such as the 104-week lookback period, in the genetic algorithm optimizer. The source code also serves as an example of using Power Basic with NeuroShell Trader.
In the first example, "retrace buy," the indicator finds the highest value of the input time series during the period specified by the parameter period. Then it finds the lowest value of the series after that high. It then computes the percent change from that low. The theory is that if the percent change is greater than, say, 10%, we are in a buy situation.
In the second example, "retrace sell," the logic is reversed. We look for the lowest value in the window (that is, the period), and starting from there we seek the high. We then compute the percent change (which will be a negative number or zero) from that high.
Use the optimizer in NeuroShell Trader Professional to find optimal values of the window size and the retracement threshold (that is, put both indicators in a trading strategy, one for buy and one for sell). Singer suggests using this indicator on weekly mutual fund data with a window size of 104 weeks.
FIGURE 5: NEUROSHELL TRADER, MUTUAL FUND SWITCHING SIGNALS. After downloading the custom buy and sell indicators from the NeuroShell Trader Website, you can insert them into a NeuroShell Trader chart.

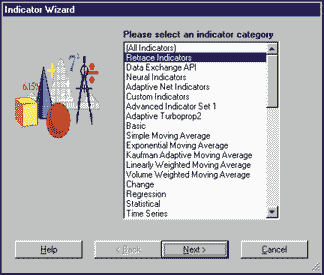
FIGURE 6: NEUROSHELL TRADER. Use the Indicator Wizard to insert indicators into your NeuroShell Trader chart, prediction, or trading strategy. In this example, select the "retrace indicators" category to insert the custom buy and sell indicators based on Jack Singer's mutual fund switching strategy after downloading them from the NeuroShell Trader Website.
After downloading the custom indicators, you can insert them into your NeuroShell Trader chart (Figure 5), prediction, or trading strategy by using the Indicator Wizard and selecting the "retrace indicators" category (Figure 6).-- Marge Sherald, Ward Systems Group, Inc.
301 662-7950
E-mail sales@wardsystems.com
https://www.neuroshell.com
GO BACKIn John Sweeney's interview with Gary Smith in this issue ("Playing The Breakouts: Gary B. Smith Of TheStreet.com"), Smith discusses how he implements stock screens in his work. The first step to implementing a stock scan in NeuroShell Trader is to create a chart with long and short signals (Figure 7). Select "New Indicator É" from the Insert menu to create the following indicators using the Indicator Wizard:
NEUROSHELL TRADER
Long Signal:
        And4 ( And 2 (
        A>B(Close, 20),
        A>B ( MovAvg ( Volume, 50 ), 500 )     ),
        A>B ( Close, Lag ( Max(Close,5), 1 )
        A>B ( Momentum(Close,1), 1 )
        A>B ( Volume, Multiply2( 1.5, MovAvg(Volume,50) ) )     )

Short Signal:
        And4 ( And 2 (
        A>B(Close, 20),
        A>B ( MovAvg ( Volume, 50 ), 500 )     ),
        A<B ( Close, Lag ( Min(Close,5), 1 )
        A<B ( Momentum(Close,1), -1 )
        A>B ( Volume, Multiply2( 1.5, MovAvg(Volume,50) )     )
FIGURE 7: NEUROSHELL TRADER, STOCK SCAN. Here are the results of a stock scan performed in NeuroShell Trader. You can view a summary of all the long and short signals for all the stocks in your scan by selecting "Portfolio View" from the View menu.
The second step to implementing a stock scan is to add the stocks that you wish to scan by selecting "Add/Remove Chart Pages É" from the Edit menu. Once the stocks have been added to the chart, you can view a summary of all the long and short signals for all the stocks by selecting "Portfolio View" from the View menu (Figure 7).
Users of NeuroShell Trader can go to the STOCKS & COMMODITIES section of the NeuroShell Trader free technical support Website to download a sample stock scan chart.-- Marge Sherald, Ward Systems Group, Inc.
301 662-7950
E-mail sales@wardsystems.com
https://www.neuroshell.com
GO BACKYou can implement an ichimoku chart in NeuroShell Trader (Figure 8) simply by recreating the five component indicators. Select "New Indicator É" from the Insert menu to create each of the following indicators using the Indicator Wizard:
NEUROSHELL TRADER
Standard Line:
        Price Range Midpoint ( High, Low, 26 )

Turning Line:
        Price Range Midpoint ( High, Low, 9 )

Delayed Line:
        Lead ( Close, 26 )

First Preceding Span:
        Lag ( Avg2 ( Standard Line, Turning Line ), 26 )

Second Preceding Span:
        Lag ( Price Range Midpoint ( High, Low, 52 ), 26 )
FIGURE 8: NEUROSHELL TRADER, ICHIMOKU CHART. Here's an ichimoku chart plotted in NeuroShell Trader. In addition, users may find the ichimoku components useful when creating trading systems with the Trading Strategy Wizard or when predicting future price movements, future highs, or future lows using the Prediction Wizard. Owners of NeuroShell Trader Professional could then use the Genetic Optimizer to determine the optimal parameters for the ichimoku components.
-- Marge Sherald, Ward Systems Group, Inc.
301 662-7950
E-mail sales@wardsystems.com
https://www.neuroshell.com
GO BACKBrian Bell's normalization techniques described in his article in this issue are easily recreated in NeuroShell Trader. Select "New Indicator É" from the Insert menu to create the following normalization indicators using the Indicator Wizard:
NEUROSHELL TRADER
Oscillator:
        Simple: Avg1 - Avg2 ( Close, 4, 8 )

Normalizing to Average Price:
        Divide ( Oscillator, MovAvg ( Close, 8 ) )

Normalizing to Standard Deviation:
        Divide ( Oscillator, StndDev ( Close, 8 ) )

Normalizing to Average True Range:
        Divide ( Oscillator, AverageTrueRange ( Close, 8 ) )

Normalizing to Range (%R):
        Williams %R ( Oscillator, Oscillator, Oscillator, 200 )
FIGURE 9: NEUROSHELL TRADER, NORMALIZATION. Here's a NeuroShell Trader chart showing different normalization techniques. In addition, users may find the normalization techniques useful when creating trading systems with the Trading Strategy Wizard or when predicting future price movements, future highs, or future lows using the Prediction Wizard. Owners of the NeuroShell Trader Professional could then use the Genetic Optimizer to determine the optimal parameters for the normalization techniques.
-- Marge Sherald, Ward Systems Group, Inc.
301 662-7950
E-mail sales@wardsystems.com
https://www.neuroshell.com
GO BACKCode for the various indicator lines of the ichimoku charts as described by Ken Muranaka in his article can be incorporated into a simple yet effective system in Byte Into The Market software, utilizing the author's ideas for trading with the ichimoku chart indicators (Figure 10).
BYTE INTO THE MARKET
FIGURE 10: BYTE INTO THE MARKET, CODE FOR ICHIMOKU CHARTS. Here's the code for the various indicator lines of the ichimoku charts as described by Ken Muranaka.
We have taken Muranaka's suggestion and adjusted the periods of the indicators for a five-business day week. Seven days are approximately a week and a half, and a month is approximately 22 days. The system requires the closing price of a bar to exceed both span lines for prices to be above the cloud/kumo and provide a long trade confirmation. The actual trading trigger must be the crossing of the turning line above the standard line.Any of the ichimoku indicators could be charted in the trade system editor by right-clicking the icon for the variable to be charted, to the left of its equal sign ("=") assignment operator. For instance, to chart the standard line, you would right-click the StandardLine icon in the first line of code. The system is available in a downloadable zip file from https://www.tarnsoft.com/ichimoku.zip.
FIGURE 11: BYTE INTO THE MARKET, CODE FOR ICHIMOKU CHART. An ichimoku chart of Microsoft plotted in Byte Into The Market shows price together with the standard line, turning line, first preceding span line, and second preceding span line.
Alternatively, individual parts of this system code can be copied via the clipboard and charted from the formula editor. We have done this for you already. The zip download also contains a chart template that can be used to create new charts for any security. The charts plot price together with charted formulas for the standard line, turning line, first preceding span line, and second preceding span line, as shown in Figure 11. The system and a system test equity curve are also charted from the template.
GO BACKShown in Figure 12 are the formulas in Byte Into The Market software for the normalizations of a moving average oscillator as given in Brian Bell's article sidebar, "Notation and conventions," elsewhere in this issue. These normalization formulas are also available in a downloadable zip file from https://www.tarnsoft.com/normal.zip.
BYTE INTO THE MARKET
FIGURE 12: BYTE INTO THE MARKET, NORMALIZATION CODE. Here are the Byte Into The Market formulas to implement the normalizations of a moving average oscillator as given by Brian Bell elsewhere in this issue. -- Tom Kohl, Tarn Software, 303 794-4184
bitm@tarnsoft.com, https://www.tarnsoft.com
GO BACKThe normalized oscillators presented in Brian Bell's article "Normalization" can be reproduced in TradingSolutions using the following formulas. These formulas can be entered as new function definitions and applied to any stock or data series.
TRADINGSOLUTIONS
FIGURE 13: TRADINGSOLUTIONS. Here's a sample chart of the S&P 500 closing price with charts of the four normalized indicators.
All the functions in the article are based on the moving average oscillator, which is the same as the value oscillator (OSC) function in TradingSolutions. The value oscillator function includes optional normalization against the shorter moving average, but it should be left off when implementing these formulas.Osc ( Data , Short Period, Long Period, 0 )Note that the values 4 and 8 from the article could be entered directly rather than making the second and third input parameters.Normalizing to average price
Divide the value oscillator by the moving average (MA) function.NormOsc_MA (Data, Short Period, Long Period) = Div(Osc(Data, Short Period, Long Period, 0), MA(Data, Long Period))Normalizing to standard deviation
Divide the value oscillator by the standard deviation (StDev) function.NormOsc_StDev(Data, Short Period, Long Period) = Div(Osc(Data, Short Period, Long Period, 0), StDev(Data, Long Period))Normalizing to average true range
Divide the value oscillator by the average true range (Atr) function. Note that in this case the high, low, and closing prices are needed to calculate the average true range.NormOsc_ATR(Close, High, Low, Short Period, Long Period) = Div(Osc(Close, Short Period, Long Period, 0), ATR(Close, High, Low, Long Period))Normalizing to range (%R)
The easiest way to do this type of normalization is to create a general %R normalization function and then apply it to the value oscillator. %R normalization (Norm%R) is basically a simplified version of the stochastic oscillator with the following formula.Norm%R(Data, Period) = Mult(Div(Sub(Data, Lowest(Data, Period)), Sub(Highest(Data, Period), Lowest(Data, Period))), 100)The value oscillator can then be normalized by inserting it as the data parameter to the %R normalization function.NormOsc_Range(Data, Short Period, Long Period, Normalization Period) = Norm%R(Osc(Data, Short Period, Long Period, 0), Normalization Period)These functions are available as a function file that can be downloaded from https://www.tradingsolutions.net in the Solution Library section. To import this file into TradingSolutions, select "Import Functions..." from the File menu. To apply the function to a stock or group of stocks, select "Add New Field..." from the context menu for the stock or group, select "Calculate a value...," then select the desired normalized oscillator from the "Traders Tips Functions" group.-- Gary Geniesse, TradingSolutions Project Lead
NeuroDimension, Inc.
800 634-3327, 352 377-5144
https://www.tradingsolutions.net
GO BACKHere's the TechniFilter Plus code to implement the mutual fund switching technique from my article in this issue, "Enhanced Fund Switching."
TECHNIFILTER PLUS
NAME: Close
FORMULA: C

NAME: Move
FORMULA: c-cy1

NAME: %
FORMULA: ((C-Cy1)/c)*100


NAME: High
PARAMETERS: H,50
FORMULA: ((&1)M&2)

NAME: % frm high
PARAMETERS: H,50
FORMULA: ((c-((&1)M&2))/((&1)M&2))*100

NAME: Rel Str
PARAMETERS: 104
FORMULA: 100*(c-cy&1)/cy&1

NAME: Lowest
SWITCHES: multiline
PARAMETERS: C,50
FORMULA: [1]: (&1)m'&2
[2]: (&1)N[1] {v}

NAME: % from Low
FORMULA: ((c-[12])/[12])*100

NAME: Recovered
FORMULA: ([13]/((([7]-[12])/[12])*100))*100

NAME: StrHld
PARAMETERS: H,50,6,19,9
FORMULA: ((c-(((&1)M&2)-(T*0.12)))U1)+(((CX&3-CX&4)-TX&5)u1)

NAME: EMA
FORMULA: CX28 <= L + .02
-- Jack Singer
GO BACKKen Muranaka's ichimoku charts are easily developed using a few of SMARTRADER's studies and functions and a few user formulas.
SMARTRADER
The standard line is recreated by first determining the highest high and lowest low over the last 26 days in rows 8 and 9 (Figure 14). Then the standard line is calculated in a user formula in row 10. The turning line is developed in the same way using the highest high and lowest close for the last 9 days, rows 11 and 12, and then calculating it in a user formula in row 13.
FIGURE 14: SMARTRADER. Here's the SMARTRADER specsheet to recreate Ken Muranaka's ichimoku charts. It uses a combination of some of SmarTrader's studies and functions plus a few user formulas.
Delayed line, row 14, is a user formula that shifts the closing price 26 days prior to today. Next, we determine the highest high and lowest low for the last 52 days in rows 17 and 18. Row 15 calculates the 1stpreceding span, and row 16 shifts it 26 days ahead of today.Rows 17 and 18 determine the highest high and lowest low for 52 days. Row 19 computes the 2ndpreceding span and row 20 uses a user row to shift 2ndpreceding span 26 days ahead of today.
The simple moving averages of close use the preprogrammed moving average study to calculate nine- and 26-day moving averages.
-- Jim Ritter, Stratagem Software International
504 885-7353, E-mail: Stratagem1@aol.com
https://www.stratagem1.com
GO BACKThe following WAVE WI$E formulas show how to compute the long and short formulas for scans based on the TC2000 example given in "Playing The Breakouts: Gary B. Smith Of TheStreet.com" in this issue. Adjust trading constants as necessary.
WAVE WI$E MARKET SPREADSHEET
B: HIGH
C: LOW
D: CLOSE
E: OPEN
F: VOL
G: Avgv50       @MAVG(VOL,50)
H: Maxc5        @MAX(HIGH[-1],5)
I: Minc5        @MIN(LOW[-1],5)
J: Longs        @IF(CLOSE > 20 & AVGV50 > 500 & CLOSE > MAXC5 &
        CLOSE > CLOSE[-1] + 1 & VOL > 1.5 * AVGV50,BUY)
K: Shorts       @IF(CLOSE > 20 & AVGV50 > 500 & CLOSE < MINC5 &
        CLOSE < CLOSE[-1] - 1 & VOL > 1.5 * AVGV50,SELL)
L:
Z:        =========End Formulas
-- Peter Di Girolamo, Jerome Technology
908 369-7503, jtiware@aol.com
https://members.aol.com/jtiware